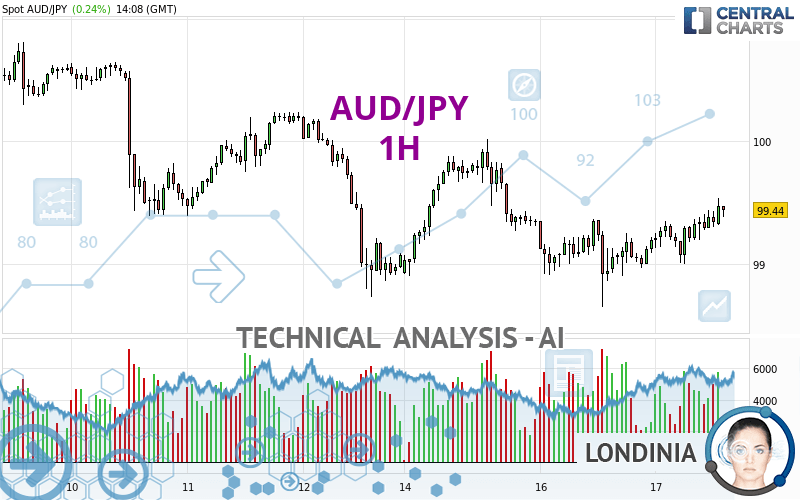
AUD/JPY - 1H - Technical analysis published on 04/17/2024 (GMT)
- 66
- 0
Click here for a new analysis!
- Timeframe : 1H
- - Analysis generated on
- Status : LEVEL MAINTAINED
Summary of the analysis

Additional analysis
Quotes
The AUD/JPY rating is 99.44 JPY. The price registered an increase of +0.24% on the session and was traded between 99.00 JPY and 99.54 JPY over the period. The price is currently at +0.44% from its lowest and -0.10% from its highest.So that you have an overall view of the price change, here is a table showing the variations over several periods:
Near a new HIGH record (5 years)
Type : Bullish
Timeframe : Weekly
Near a new HIGH record (1 year)
Type : Bullish
Timeframe : Weekly
Near a new LOW record (1st january)
Type : Bearish
Timeframe : Weekly
Near a new HIGH record (1 month)
Type : Bullish
Timeframe : Weekly
Technical
Technical analysis of this 1H chart of AUD/JPY indicates that the overall trend is not clearly defined. This indecision could turn into a bullish trend due to the strong bullish signals currently being given by short-term moving averages. An assessment of moving averages reveals several bearish and bullish signals:
Bullish trend reversal : adaptative moving average 100
Type : Bullish
Timeframe : 1 hour
Bearish price crossover with Moving Average 100
Type : Bearish
Timeframe : 1 hour
Bearish price crossover with adaptative moving average 50
Type : Bearish
Timeframe : 1 hour
The technical indicators are bullish. There is still some doubt about the price increase.
But beware of excesses. The Central Indicators scanner currently detects this:
CCI indicator is overbought : over 100
Type : Neutral
Timeframe : 1 hour
RSI indicator: bearish divergence
Type : Bearish
Timeframe : 1 hour
Williams %R indicator is overbought : over -20
Type : Neutral
Timeframe : 1 hour
Ichimoku : price is over the cloud
Type : Bullish
Timeframe : 1 hour
SuperTrend indicator bullish reversal
Type : Bullish
Timeframe : 1 hour
Central Patterns, the market scanner focusing on chart patterns, resistances and supports found these results:
Near horizontal resistance
Type : Bearish
Timeframe : 1 hour
Near resistance of triangle
Type : Bearish
Timeframe : 1 hour
Resistance of channel is broken
Type : Bullish
Timeframe : 1 hour
The Central Candlesticks scanner which studies Japanese candlesticks did not detect anything.
| S3 | S2 | S1 | Price | R1 | R2 | R3 | |
|---|---|---|---|---|---|---|---|
| ProTrendLines | 98.91 | 99.19 | 99.38 | 99.44 | 99.64 | 100.02 | 100.24 |
| Change (%) | -0.53% | -0.25% | -0.06% | - | +0.20% | +0.58% | +0.80% |
| Change | -0.53 | -0.25 | -0.06 | - | +0.20 | +0.58 | +0.80 |
| Level | Minor | Minor | Major | - | Major | Minor | Intermediate |
Pivot points can also be used to set your price objectives. Here is the price situation in relation to pivot points:
| Pivot points | S3 | S2 | S1 | PP | R1 | R2 | R3 |
|---|---|---|---|---|---|---|---|
| Standard | 98.06 | 98.35 | 98.78 | 99.07 | 99.50 | 99.79 | 100.22 |
| Camarilla | 99.00 | 99.07 | 99.13 | 99.20 | 99.27 | 99.33 | 99.40 |
| Woodie | 98.12 | 98.39 | 98.84 | 99.11 | 99.56 | 99.83 | 100.28 |
| Fibonacci | 98.35 | 98.63 | 98.80 | 99.07 | 99.35 | 99.52 | 99.79 |
| Pivot points | S3 | S2 | S1 | PP | R1 | R2 | R3 |
|---|---|---|---|---|---|---|---|
| Standard | 96.18 | 97.46 | 98.26 | 99.54 | 100.34 | 101.62 | 102.42 |
| Camarilla | 98.50 | 98.69 | 98.88 | 99.07 | 99.26 | 99.45 | 99.64 |
| Woodie | 95.95 | 97.34 | 98.03 | 99.42 | 100.11 | 101.50 | 102.19 |
| Fibonacci | 97.46 | 98.25 | 98.74 | 99.54 | 100.33 | 100.82 | 101.62 |
| Pivot points | S3 | S2 | S1 | PP | R1 | R2 | R3 |
|---|---|---|---|---|---|---|---|
| Standard | 93.62 | 95.26 | 96.91 | 98.55 | 100.20 | 101.84 | 103.49 |
| Camarilla | 97.66 | 97.96 | 98.26 | 98.56 | 98.86 | 99.16 | 99.47 |
| Woodie | 93.63 | 95.26 | 96.92 | 98.55 | 100.21 | 101.84 | 103.50 |
| Fibonacci | 95.26 | 96.52 | 97.29 | 98.55 | 99.81 | 100.58 | 101.84 |
Numerical data
The following is the status of the technical indicators and moving averages at the time of publication of this technical analysis:
| RSI (14): | 57.49 | |
| MACD (12,26,9): | 0.0500 | |
| Directional Movement: | 6.31 | |
| AROON (14): | 50.00 | |
| DEMA (21): | 99.34 | |
| Parabolic SAR (0,02-0,02-0,2): | 99.20 | |
| Elder Ray (13): | 0.13 | |
| Super Trend (3,10): | 99.52 | |
| Zig ZAG (10): | 99.42 | |
| VORTEX (21): | 1.1600 | |
| Stochastique (14,3,5): | 79.46 | |
| TEMA (21): | 99.41 | |
| Williams %R (14): | -29.63 | |
| Chande Momentum Oscillator (20): | 0.08 | |
| Repulse (5,40,3): | 0.0000 | |
| ROCnROLL: | 1 | |
| TRIX (15,9): | 0.0000 | |
| Courbe Coppock: | 0.39 |
| MA7: | 99.62 | |
| MA20: | 99.29 | |
| MA50: | 98.48 | |
| MA100: | 97.61 | |
| MAexp7: | 99.37 | |
| MAexp20: | 99.28 | |
| MAexp50: | 99.29 | |
| MAexp100: | 99.42 | |
| Price / MA7: | -0.18% | |
| Price / MA20: | +0.15% | |
| Price / MA50: | +0.97% | |
| Price / MA100: | +1.87% | |
| Price / MAexp7: | +0.07% | |
| Price / MAexp20: | +0.16% | |
| Price / MAexp50: | +0.15% | |
| Price / MAexp100: | +0.02% |
News
Don't forget to follow the news on AUD/JPY. At the time of publication of this analysis, the latest news was as follows:
-
 AUD/JPY Forecast January 6, 2023
-
AUD/JPY Forecast December 16, 2022
-
Risk event for the week: Long #AUDJPY
-
Trade of the Week: long AUD/JPY
-
Market Sentiment Webinar: Positive for USD, Bullish Signal on AUD/JPY
About author

Online


Add a comment
Comments
0 comments on the analysis AUD/JPY - 1H