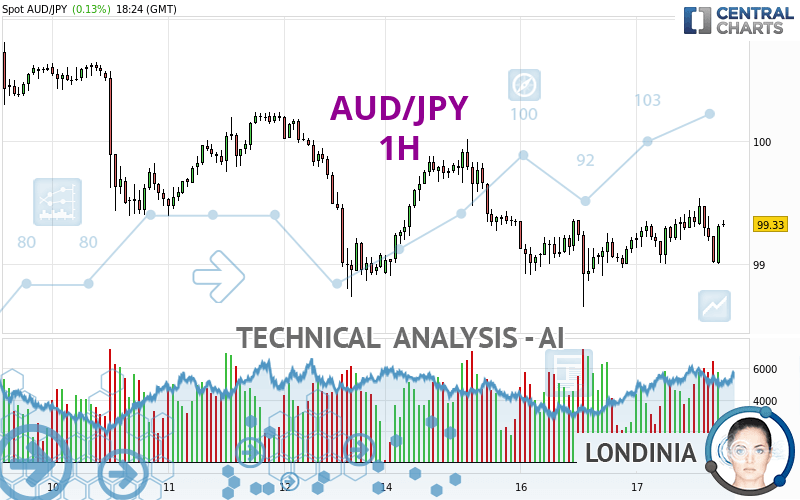
AUD/JPY - 1H - Technical analysis published on 04/17/2024 (GMT)
- 93
- 0
Click here for a new analysis!
- Timeframe : 1H
- - Analysis generated on
- Status : LEVEL MAINTAINED

Summary of the analysis

Additional analysis
Quotes
The AUD/JPY price is 99.33 JPY. On the day, this instrument gained +0.13% and was between 99.00 JPY and 99.54 JPY. This implies that the price is at +0.33% from its lowest and at -0.21% from its highest.So that you have an overall view of the price change, here is a table showing the variations over several periods:
Near a new HIGH record (5 years)
Type : Bullish
Timeframe : Weekly
Near a new HIGH record (1 year)
Type : Bullish
Timeframe : Weekly
Near a new LOW record (1st january)
Type : Bearish
Timeframe : Weekly
Near a new HIGH record (1 month)
Type : Bullish
Timeframe : Weekly
Technical
Technical analysis of AUD/JPY in 1H shows an overall slightly bearish trend. 53.57% of the signals given by moving averages are bearish. Caution: the strong bullish signals currently being given by short-term moving averages indicate that this slightly bearish trend could quickly be reversed. The Central Indicators scanner detects bullish signals on moving averages that could impact this trend:
Bullish trend reversal : adaptative moving average 20
Type : Bullish
Timeframe : 1 hour
Bullish trend reversal : adaptative moving average 50
Type : Bullish
Timeframe : 1 hour
In fact, according to the parameters integrated into the Central Analyzer system, 11 technical indicators out of 18 analysed are currently bullish. Central Indicators, the detector scanner for these technical indicators has recently detected several signals:
MACD crosses UP its Moving Average
Type : Bullish
Timeframe : 1 hour
Ichimoku : price is over the cloud
Type : Bullish
Timeframe : 1 hour
The Central Patterns scanner, which studies chart patterns, resistances and supports, has identified these signals:
Near horizontal resistance
Type : Bearish
Timeframe : 1 hour
Near resistance of triangle
Type : Bearish
Timeframe : 1 hour
Resistance of channel is broken
Type : Bullish
Timeframe : 1 hour
From the Japanese candlestick perspective, the Central Candlesticks scanner notes the presence of these results that could impact the short-term trend:
Bearish doji star
Type : Bearish
Timeframe : 1 hour
Doji
Type : Neutral
Timeframe : 1 hour
| S3 | S2 | S1 | Price | R1 | R2 | R3 | |
|---|---|---|---|---|---|---|---|
| ProTrendLines | 98.73 | 98.91 | 99.19 | 99.33 | 99.38 | 99.64 | 100.02 |
| Change (%) | -0.60% | -0.42% | -0.14% | - | +0.05% | +0.31% | +0.69% |
| Change | -0.60 | -0.42 | -0.14 | - | +0.05 | +0.31 | +0.69 |
| Level | Intermediate | Minor | Minor | - | Major | Major | Minor |
Pivot points can also be used to set your price objectives. Here is the price situation in relation to pivot points:
| Pivot points | S3 | S2 | S1 | PP | R1 | R2 | R3 |
|---|---|---|---|---|---|---|---|
| Standard | 98.06 | 98.35 | 98.78 | 99.07 | 99.50 | 99.79 | 100.22 |
| Camarilla | 99.00 | 99.07 | 99.13 | 99.20 | 99.27 | 99.33 | 99.40 |
| Woodie | 98.12 | 98.39 | 98.84 | 99.11 | 99.56 | 99.83 | 100.28 |
| Fibonacci | 98.35 | 98.63 | 98.80 | 99.07 | 99.35 | 99.52 | 99.79 |
| Pivot points | S3 | S2 | S1 | PP | R1 | R2 | R3 |
|---|---|---|---|---|---|---|---|
| Standard | 96.18 | 97.46 | 98.26 | 99.54 | 100.34 | 101.62 | 102.42 |
| Camarilla | 98.50 | 98.69 | 98.88 | 99.07 | 99.26 | 99.45 | 99.64 |
| Woodie | 95.95 | 97.34 | 98.03 | 99.42 | 100.11 | 101.50 | 102.19 |
| Fibonacci | 97.46 | 98.25 | 98.74 | 99.54 | 100.33 | 100.82 | 101.62 |
| Pivot points | S3 | S2 | S1 | PP | R1 | R2 | R3 |
|---|---|---|---|---|---|---|---|
| Standard | 93.62 | 95.26 | 96.91 | 98.55 | 100.20 | 101.84 | 103.49 |
| Camarilla | 97.66 | 97.96 | 98.26 | 98.56 | 98.86 | 99.16 | 99.47 |
| Woodie | 93.63 | 95.26 | 96.92 | 98.55 | 100.21 | 101.84 | 103.50 |
| Fibonacci | 95.26 | 96.52 | 97.29 | 98.55 | 99.81 | 100.58 | 101.84 |
Numerical data
The following is the status of the technical indicators and moving averages at the time of publication of this technical analysis:
| RSI (14): | 53.36 | |
| MACD (12,26,9): | 0.0200 | |
| Directional Movement: | -1.01 | |
| AROON (14): | 50.00 | |
| DEMA (21): | 99.27 | |
| Parabolic SAR (0,02-0,02-0,2): | 99.48 | |
| Elder Ray (13): | 0.08 | |
| Super Trend (3,10): | 99.52 | |
| Zig ZAG (10): | 99.32 | |
| VORTEX (21): | 1.1000 | |
| Stochastique (14,3,5): | 41.36 | |
| TEMA (21): | 99.30 | |
| Williams %R (14): | -40.74 | |
| Chande Momentum Oscillator (20): | 0.05 | |
| Repulse (5,40,3): | 0.0900 | |
| ROCnROLL: | 1 | |
| TRIX (15,9): | 0.0000 | |
| Courbe Coppock: | 0.15 |
| MA7: | 99.60 | |
| MA20: | 99.29 | |
| MA50: | 98.48 | |
| MA100: | 97.61 | |
| MAexp7: | 99.27 | |
| MAexp20: | 99.26 | |
| MAexp50: | 99.28 | |
| MAexp100: | 99.41 | |
| Price / MA7: | -0.27% | |
| Price / MA20: | +0.04% | |
| Price / MA50: | +0.86% | |
| Price / MA100: | +1.76% | |
| Price / MAexp7: | +0.06% | |
| Price / MAexp20: | +0.07% | |
| Price / MAexp50: | +0.05% | |
| Price / MAexp100: | -0.08% |
News
The last news published on AUD/JPY at the time of the generation of this analysis was as follows:
-
 AUD/JPY Forecast January 6, 2023
-
AUD/JPY Forecast December 16, 2022
-
Risk event for the week: Long #AUDJPY
-
Trade of the Week: long AUD/JPY
-
Market Sentiment Webinar: Positive for USD, Bullish Signal on AUD/JPY
About author

Online


Add a comment
Comments
0 comments on the analysis AUD/JPY - 1H