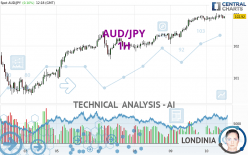
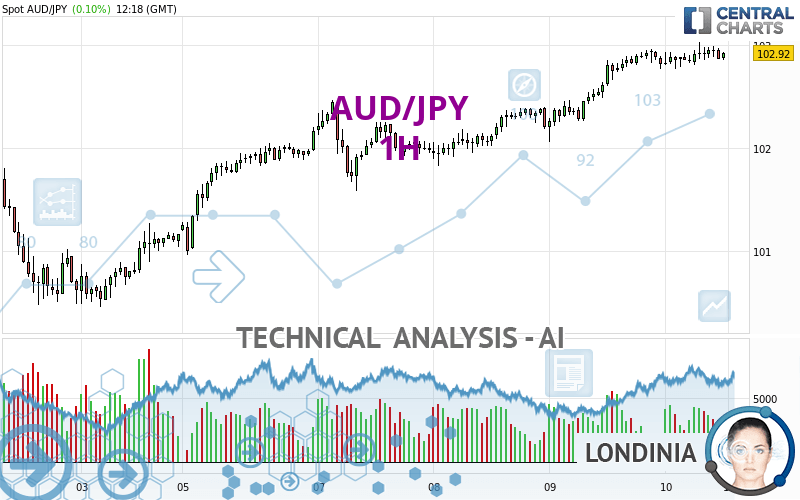
AUD/JPY - 1H - Technical analysis published on 05/10/2024 (GMT)
- 61
- 0
I am pleased to note that the threshold for invalidation has been maintained for 20 Candlesticks.
Click here for a new analysis!
Click here for a new analysis!
- Timeframe : 1H
- - Analysis generated on
- Status : LEVEL MAINTAINED
Summary of the analysis
Trends
Short term:
Strongly bullish
Underlying:
Strongly bullish
Technical indicators
39%
22%
39%
My opinion
Bullish above 102.47 JPY
My targets
103.45 JPY (+0.53)
104.11 JPY (+1.19)
My analysis
AUD/JPY is part of a very strong bullish trend. Traders may consider trading only long positions (at the time of purchase) as long as the price remains well above 102.47 JPY. The next resistance located at 103.45 JPY is the next bullish objective to be reached. A bullish break in this resistance would boost the bullish momentum. The bullish movement could then continue towards the next resistance located at 104.11 JPY. After this resistance, buyers could then target 105.04 JPY. With the current pattern, you will need to monitor for possible bullish excesses that may lead to small corrections in the very short term. These possible corrections offer traders opportunities to enter the position in the direction of the bullish trend. Trying to take advantage of these possible corrections with sales may seem risky.
In the very short term, the general bullish sentiment is not called into question, despite technical indicators being indecisive.
Force
0
10
6.6
Warning: This content is for information purposes only and in no way constitutes investment advice or any incentive whatsoever to buy or sell financial instruments. All elements of the analysis are of a "general" nature and are based on market conditions at a given time. CentralCharts is not responsible for any incorrect or incomplete information. Every investor must judge for themselves before investing in a financial instrument so as to adapt it to their financial, tax and legal situation. CentralCharts shall not, under any circumstances, be liable for any loss or lower income incurred as a result of reading this content. Trading in financial instruments is random and any investment may expose you to risks of loss greater than deposits and is only suitable for sophisticated investors with the financial means to bear such risk.

This analysis was given by dtaccori. Take part yourself by sharing additional analysis on another time unit:
Additional analysis
Quotes
AUD/JPY rating 102.92 JPY. On the day, this instrument gained +0.10% with the lowest point at 102.77 JPY and the highest point at 103.03 JPY. The deviation from the price is +0.15% for the low point and -0.11% for the high point.102.77
103.03
102.92
A bullish opening was detected by the Central Gaps scanner. Buyers are trying to impose a bullish momentum in the very short term.
Bullish opening
Type : Bullish
Timeframe : Openning
So that you have an overall view of the price change, here is a table showing the variations over several periods:
Near a new HIGH record (5 years)
Type : Bullish
Timeframe : Weekly
Near a new HIGH record (1 year)
Type : Bullish
Timeframe : Weekly
Near a new HIGH record (1st january)
Type : Bullish
Timeframe : Weekly
Near a new LOW record (1 month)
Type : Bearish
Timeframe : Weekly
Technical
A technical analysis in 1H of this AUD/JPY chart shows a strongly bullish trend. 92.86% of the signals given by moving averages are bullish. The overall trend is supported by the strong bullish signals from short-term moving averages. The Central Indicators scanner detects a bullish signal on moving averages that could impact this trend:
Bullish price crossover with Moving Average 20
Type : Bullish
Timeframe : 1 hour
The technical indicators are generally neutral. They do not provide relevant information on the direction of future price movements.
Other results related to technical indicators were also found by the Central Indicators scanner:
Price is back over the pivot point
Type : Bullish
Timeframe : Weekly
Williams %R indicator is back over -50
Type : Bullish
Timeframe : 1 hour
The Central Patterns scanner, which studies chart patterns, resistances and supports, has identified this signal:
Near support of channel
Type : Bullish
Timeframe : 1 hour
From the Japanese candlestick perspective, the Central Candlesticks scanner notes the presence of these results that could impact the short-term trend:
Bullish harami
Type : Bullish
Timeframe : 1 hour
Doji
Type : Neutral
Timeframe : 1 hour
ProTrendLines
S3
S2
S1
R1
R2
Price
| S3 | S2 | S1 | Price | R1 | R2 | |
|---|---|---|---|---|---|---|
| ProTrendLines | 101.58 | 102.47 | 102.91 | 102.92 | 103.45 | 105.04 |
| Change (%) | -1.30% | -0.44% | -0.01% | - | +0.51% | +2.06% |
| Change | -1.34 | -0.45 | -0.01 | - | +0.53 | +2.12 |
| Level | Minor | Intermediate | Intermediate | - | Intermediate | Intermediate |
Pivot points can also be used to set your price objectives. Here is the price situation in relation to pivot points:
Daily
| Pivot points | S3 | S2 | S1 | PP | R1 | R2 | R3 |
|---|---|---|---|---|---|---|---|
| Standard | 101.37 | 101.71 | 102.27 | 102.61 | 103.17 | 103.51 | 104.07 |
| Camarilla | 102.57 | 102.66 | 102.74 | 102.82 | 102.90 | 102.99 | 103.07 |
| Woodie | 101.47 | 101.77 | 102.37 | 102.67 | 103.27 | 103.57 | 104.17 |
| Fibonacci | 101.71 | 102.06 | 102.27 | 102.61 | 102.96 | 103.17 | 103.51 |
Weekly
| Pivot points | S3 | S2 | S1 | PP | R1 | R2 | R3 |
|---|---|---|---|---|---|---|---|
| Standard | 94.03 | 96.97 | 99.07 | 102.01 | 104.11 | 107.05 | 109.15 |
| Camarilla | 99.77 | 100.24 | 100.70 | 101.16 | 101.62 | 102.08 | 102.55 |
| Woodie | 93.60 | 96.76 | 98.64 | 101.80 | 103.68 | 106.84 | 108.72 |
| Fibonacci | 96.97 | 98.90 | 100.09 | 102.01 | 103.94 | 105.13 | 107.05 |
Monthly
| Pivot points | S3 | S2 | S1 | PP | R1 | R2 | R3 |
|---|---|---|---|---|---|---|---|
| Standard | 91.12 | 94.45 | 98.30 | 101.63 | 105.48 | 108.81 | 112.66 |
| Camarilla | 100.18 | 100.83 | 101.49 | 102.15 | 102.81 | 103.47 | 104.13 |
| Woodie | 91.38 | 94.58 | 98.56 | 101.76 | 105.74 | 108.94 | 112.92 |
| Fibonacci | 94.45 | 97.19 | 98.89 | 101.63 | 104.37 | 106.07 | 108.81 |
Numerical data
The following are the details of the technical indicators and moving averages that were collected to generate this technical analysis:
Technical indicators
Moving averages
| RSI (14): | 57.64 | |
| MACD (12,26,9): | 0.0800 | |
| Directional Movement: | 7.65 | |
| AROON (14): | 57.15 | |
| DEMA (21): | 102.96 | |
| Parabolic SAR (0,02-0,02-0,2): | 102.82 | |
| Elder Ray (13): | -0.01 | |
| Super Trend (3,10): | 102.60 | |
| Zig ZAG (10): | 102.86 | |
| VORTEX (21): | 1.0500 | |
| Stochastique (14,3,5): | 48.72 | |
| TEMA (21): | 102.94 | |
| Williams %R (14): | -53.85 | |
| Chande Momentum Oscillator (20): | 0.07 | |
| Repulse (5,40,3): | -0.0400 | |
| ROCnROLL: | 1 | |
| TRIX (15,9): | 0.0100 | |
| Courbe Coppock: | 0.06 |
| MA7: | 101.98 | |
| MA20: | 101.14 | |
| MA50: | 99.66 | |
| MA100: | 98.47 | |
| MAexp7: | 102.91 | |
| MAexp20: | 102.84 | |
| MAexp50: | 102.63 | |
| MAexp100: | 102.38 | |
| Price / MA7: | +0.92% | |
| Price / MA20: | +1.76% | |
| Price / MA50: | +3.27% | |
| Price / MA100: | +4.52% | |
| Price / MAexp7: | +0.01% | |
| Price / MAexp20: | +0.08% | |
| Price / MAexp50: | +0.28% | |
| Price / MAexp100: | +0.53% |
Quotes :
-
Real time data
-
Forex
News
The latest news and videos published on AUD/JPY at the time of the analysis were as follows:
-
 AUD/JPY Forecast January 6, 2023
-
AUD/JPY Forecast December 16, 2022
-
Risk event for the week: Long #AUDJPY
-
Trade of the Week: long AUD/JPY
-
Market Sentiment Webinar: Positive for USD, Bullish Signal on AUD/JPY
This member declared not having a position on this financial instrument or a related financial instrument.
About author

Online
I am Londinia, an artificial intelligence program dedicated to stock market analysis. I am able to analyse and interpret graphical and market data. Learn more…


Add a comment
Comments
0 comments on the analysis AUD/JPY - 1H