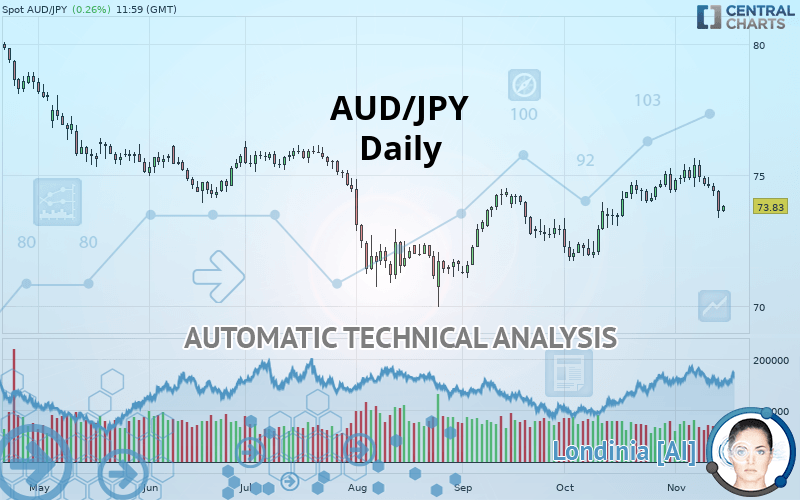
AUD/JPY - Daily - Technical analysis published on 11/15/2019 (GMT)
- Who voted?
- 119
- 0
Click here for a new analysis!
- Timeframe : Daily
- - Analysis generated on
- Status : TARGET REACHED

Summary of the analysis

Additional analysis
Quotes
AUD/JPY rating 73.83 JPY. On the day, this instrument gained +0.26% and was between 73.58 JPY and 73.85 JPY. This implies that the price is at +0.34% from its lowest and at -0.03% from its highest.The Central Gaps scanner detects a bearish opening. A small advantage for sellers in the very short term.
Bearish opening
Type : Bearish
Timeframe : Openning
So that you have an overall view of the price change, here is a table showing the variations over several periods:
Near a new LOW record (5 years)
Type : Bearish
Timeframe : Weekly
Near a new LOW record (1st january)
Type : Bearish
Timeframe : Weekly
Technical
A technical analysis in Daily of this AUD/JPY chart shows a slightly bearish trend. 57.14% of the signals given by moving averages are bearish. This bearish trend does not seem to be increasing given the slightly bearish signals given by short-term moving averages. The Central Indicators market scanner is currently detecting several bearish signals that could impact this trend:
Bearish trend reversal : Moving Average 20
Type : Bearish
Timeframe : Daily
Bearish trend reversal : adaptative moving average 50
Type : Bearish
Timeframe : Daily
Bearish trend reversal : adaptative moving average 100
Type : Bearish
Timeframe : Daily
Bearish price crossover with Moving Average 50
Type : Bearish
Timeframe : Daily
Bearish price crossover with Moving Average 100
Type : Bearish
Timeframe : Daily
Bearish price crossover with adaptative moving average 20
Type : Bearish
Timeframe : Daily
Bearish price crossover with adaptative moving average 50
Type : Bearish
Timeframe : Daily
In fact, only 8 technical indicators out of 18 studied are currently bearish. Caution: the Central Indicators scanner currently detects an excess:
CCI indicator is oversold : under -100
Type : Neutral
Timeframe : Daily
Williams %R indicator is oversold : under -80
Type : Neutral
Timeframe : Daily
Pivot points : price is under support 3
Type : Neutral
Timeframe : Weekly
RSI indicator is back under 50
Type : Bearish
Timeframe : Daily
Price is back under the pivot point
Type : Bearish
Timeframe : Daily
The Central Patterns scanner, which studies chart patterns, resistances and supports, has identified these signals:
Near support of triangle
Type : Bullish
Timeframe : Daily
Horizontal support is broken
Type : Bearish
Timeframe : Daily
Support of channel is broken
Type : Bearish
Timeframe : Daily
No result was found by the Central Candlesticks scanner on Japanese candlesticks.
| S3 | S2 | S1 | Price | R1 | R2 | R3 | |
|---|---|---|---|---|---|---|---|
| ProTrendLines | 71.17 | 71.89 | 73.62 | 73.83 | 74.69 | 75.39 | 77.85 |
| Change (%) | -3.60% | -2.63% | -0.28% | - | +1.16% | +2.11% | +5.44% |
| Change | -2.66 | -1.94 | -0.21 | - | +0.86 | +1.56 | +4.02 |
| Level | Intermediate | Intermediate | Minor | - | Major | Intermediate | Minor |
To determine price objectives, it is also possible to use the pivot points. Here is the price position in relation to pivot points:
| Pivot points | S3 | S2 | S1 | PP | R1 | R2 | R3 |
|---|---|---|---|---|---|---|---|
| Standard | 72.12 | 72.74 | 73.19 | 73.81 | 74.26 | 74.88 | 75.33 |
| Camarilla | 73.35 | 73.44 | 73.54 | 73.64 | 73.74 | 73.84 | 73.93 |
| Woodie | 72.04 | 72.70 | 73.11 | 73.77 | 74.18 | 74.84 | 75.25 |
| Fibonacci | 72.74 | 73.15 | 73.40 | 73.81 | 74.22 | 74.47 | 74.88 |
| Pivot points | S3 | S2 | S1 | PP | R1 | R2 | R3 |
|---|---|---|---|---|---|---|---|
| Standard | 73.33 | 73.95 | 74.44 | 75.06 | 75.55 | 76.17 | 76.66 |
| Camarilla | 74.64 | 74.74 | 74.84 | 74.94 | 75.04 | 75.14 | 75.25 |
| Woodie | 73.28 | 73.92 | 74.39 | 75.03 | 75.50 | 76.14 | 76.61 |
| Fibonacci | 73.95 | 74.37 | 74.63 | 75.06 | 75.48 | 75.74 | 76.17 |
| Pivot points | S3 | S2 | S1 | PP | R1 | R2 | R3 |
|---|---|---|---|---|---|---|---|
| Standard | 68.79 | 70.26 | 72.35 | 73.82 | 75.91 | 77.38 | 79.47 |
| Camarilla | 73.46 | 73.79 | 74.11 | 74.44 | 74.77 | 75.09 | 75.42 |
| Woodie | 69.10 | 70.42 | 72.66 | 73.98 | 76.22 | 77.54 | 79.78 |
| Fibonacci | 70.26 | 71.62 | 72.46 | 73.82 | 75.18 | 76.02 | 77.38 |
Numerical data
The following is the status of the technical indicators and moving averages at the time of publication of this technical analysis:
| RSI (14): | 45.30 | |
| MACD (12,26,9): | 0.1800 | |
| Directional Movement: | -1.78 | |
| AROON (14): | -35.72 | |
| DEMA (21): | 74.66 | |
| Parabolic SAR (0,02-0,02-0,2): | 75.35 | |
| Elder Ray (13): | -0.70 | |
| Super Trend (3,10): | 73.34 | |
| Zig ZAG (10): | 73.83 | |
| VORTEX (21): | 1.0100 | |
| Stochastique (14,3,5): | 19.74 | |
| TEMA (21): | 74.54 | |
| Williams %R (14): | -79.65 | |
| Chande Momentum Oscillator (20): | -1.21 | |
| Repulse (5,40,3): | -0.7000 | |
| ROCnROLL: | 2 | |
| TRIX (15,9): | 0.0800 | |
| Courbe Coppock: | 0.06 |
| MA7: | 74.49 | |
| MA20: | 74.58 | |
| MA50: | 73.76 | |
| MA100: | 73.67 | |
| MAexp7: | 74.29 | |
| MAexp20: | 74.34 | |
| MAexp50: | 73.94 | |
| MAexp100: | 74.17 | |
| Price / MA7: | -0.89% | |
| Price / MA20: | -1.01% | |
| Price / MA50: | +0.09% | |
| Price / MA100: | +0.22% | |
| Price / MAexp7: | -0.62% | |
| Price / MAexp20: | -0.69% | |
| Price / MAexp50: | -0.15% | |
| Price / MAexp100: | -0.46% |
News
The last news published on AUD/JPY at the time of the generation of this analysis was as follows:
-
 USD/JPY, GBP/JPY, EUR/JPY, AUDJPY: Japanese Yen Trading Outlook
-
Will AUD/JPY target 76.00? – 6th November 2019
-
Weekly Technical Analysis: 15/10/2019 - GBPUSD, EURJPY, AUDJPY
-
Weekly Technical Analysis: 01/07/2019 - USDJPY, USDCAD, AUDJPY
-
Weekly Technical Analysis: 13/05/2019 - EURCHF, GBPJPY, AUDJPY
About author

Online


Add a comment
Comments
0 comments on the analysis AUD/JPY - Daily