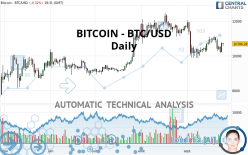
BITCOIN - BTC/USD - Daily - Technical analysis published on 09/25/2020 (GMT)
- 162
- 0
- Timeframe : Daily
- - Analysis generated on
- Status : NEUTRAL

Summary of the analysis

Additional analysis
Quotes
BITCOIN - BTC/USD rating 10,706.28 USD. The price is lower by -0.32% since the last closing with the lowest point at 10,553.01 USD and the highest point at 10,761.39 USD. The deviation from the price is +1.45% for the low point and -0.51% for the high point.The Central Gaps scanner detects a bearish opening marking the presence of sellers ahead of buyers at the opening but not sufficiently marked to allow the price to register a quotation gap.
Bearish opening
Type : Bearish
Timeframe : Openning
Here is a more detailed summary of the historical variations registered by BITCOIN - BTC/USD:
Technical
Technical analysis of BITCOIN - BTC/USD in Daily shows an overall slightly bullish trend. Only 50.00% of the signals given by moving averages are bullish. This slightly bullish trend could return to neutral given the neutral signals also given by short-term moving averages. An assessment of moving averages reveals several bullish signals that could impact this trend:
Bullish price crossover with Moving Average 20
Type : Bullish
Timeframe : Daily
Bullish price crossover with Moving Average 100
Type : Bullish
Timeframe : Daily
Bullish price crossover with adaptative moving average 100
Type : Bullish
Timeframe : Daily
In fact, only 9 technical indicators out of 18 studied are currently positioned bullish. But beware of excesses. The Central Indicators scanner currently detects this:
MACD indicator: bullish divergence
Type : Bullish
Timeframe : Daily
RSI indicator: bullish divergence
Type : Bullish
Timeframe : Daily
MACD crosses UP its Moving Average
Type : Bullish
Timeframe : Daily
Price is back over the pivot point
Type : Bullish
Timeframe : Daily
Price is back over the pivot point
Type : Bullish
Timeframe : Weekly
Momentum indicator is back over 0
Type : Bullish
Timeframe : Daily
Williams %R indicator is back over -50
Type : Bullish
Timeframe : Daily
No signals are given by Central Patterns, a market scanner specialised in chart patterns, resistances and supports.
No result was found by the Central Candlesticks scanner on Japanese candlesticks.
| S3 | S2 | S1 | Price | R1 | R2 | R3 | |
|---|---|---|---|---|---|---|---|
| ProTrendLines | 7,367.90 | 9,272.16 | 10,371.20 | 10,706.28 | 11,504.60 | 12,932.90 | 19,345.50 |
| Change (%) | -31.18% | -13.40% | -3.13% | - | +7.46% | +20.80% | +80.69% |
| Change | -3,338.38 | -1,434.12 | -335.08 | - | +798.32 | +2,226.62 | +8,639.22 |
| Level | Minor | Intermediate | Major | - | Intermediate | Intermediate | Intermediate |
To determine price objectives, it is also possible to use the pivot points. Here is the price position in relation to pivot points:
| Pivot points | S3 | S2 | S1 | PP | R1 | R2 | R3 |
|---|---|---|---|---|---|---|---|
| Standard | 9,761.97 | 9,977.33 | 10,358.78 | 10,574.14 | 10,955.59 | 11,170.95 | 11,552.40 |
| Camarilla | 10,576.11 | 10,630.82 | 10,685.52 | 10,740.23 | 10,794.94 | 10,849.65 | 10,904.35 |
| Woodie | 9,845.02 | 10,018.85 | 10,441.83 | 10,615.66 | 11,038.64 | 11,212.47 | 11,635.45 |
| Fibonacci | 9,977.33 | 10,205.31 | 10,346.16 | 10,574.14 | 10,802.12 | 10,942.97 | 11,170.95 |
| Pivot points | S3 | S2 | S1 | PP | R1 | R2 | R3 |
|---|---|---|---|---|---|---|---|
| Standard | 9,507.64 | 9,859.62 | 10,470.34 | 10,822.32 | 11,433.04 | 11,785.02 | 12,395.74 |
| Camarilla | 10,816.32 | 10,904.57 | 10,992.81 | 11,081.06 | 11,169.31 | 11,257.56 | 11,345.80 |
| Woodie | 9,637.01 | 9,924.31 | 10,599.71 | 10,887.01 | 11,562.41 | 11,849.71 | 12,525.11 |
| Fibonacci | 9,859.62 | 10,227.37 | 10,454.57 | 10,822.32 | 11,190.07 | 11,417.27 | 11,785.02 |
| Pivot points | S3 | S2 | S1 | PP | R1 | R2 | R3 |
|---|---|---|---|---|---|---|---|
| Standard | 8,975.53 | 9,837.67 | 10,747.93 | 11,610.07 | 12,520.33 | 13,382.47 | 14,292.73 |
| Camarilla | 11,170.79 | 11,333.26 | 11,495.73 | 11,658.20 | 11,820.67 | 11,983.14 | 12,145.61 |
| Woodie | 8,999.60 | 9,849.70 | 10,772.00 | 11,622.10 | 12,544.40 | 13,394.50 | 14,316.80 |
| Fibonacci | 9,837.67 | 10,514.72 | 10,933.01 | 11,610.07 | 12,287.12 | 12,705.41 | 13,382.47 |
Numerical data
The following is the status of technical indicators and moving averages registered at the time this technical analysis was created:
| RSI (14): | 49.05 | |
| MACD (12,26,9): | -95.2600 | |
| Directional Movement: | -4.55 | |
| AROON (14): | -28.57 | |
| DEMA (21): | 10,570.27 | |
| Parabolic SAR (0,02-0,02-0,2): | 11,133.22 | |
| Elder Ray (13): | -9.67 | |
| Super Trend (3,10): | 11,505.38 | |
| Zig ZAG (10): | 10,712.18 | |
| VORTEX (21): | 1.0800 | |
| Stochastique (14,3,5): | 40.71 | |
| TEMA (21): | 10,551.11 | |
| Williams %R (14): | -45.29 | |
| Chande Momentum Oscillator (20): | 371.74 | |
| Repulse (5,40,3): | 2.4500 | |
| ROCnROLL: | -1 | |
| TRIX (15,9): | -0.1900 | |
| Courbe Coppock: | 6.05 |
| MA7: | 10,662.34 | |
| MA20: | 10,571.84 | |
| MA50: | 11,156.22 | |
| MA100: | 10,449.65 | |
| MAexp7: | 10,644.34 | |
| MAexp20: | 10,714.83 | |
| MAexp50: | 10,787.36 | |
| MAexp100: | 10,466.28 | |
| Price / MA7: | +0.41% | |
| Price / MA20: | +1.27% | |
| Price / MA50: | -4.03% | |
| Price / MA100: | +2.46% | |
| Price / MAexp7: | +0.58% | |
| Price / MAexp20: | -0.08% | |
| Price / MAexp50: | -0.75% | |
| Price / MAexp100: | +2.29% |
About author

Online


Add a comment
Comments
0 comments on the analysis BITCOIN - BTC/USD - Daily