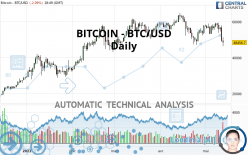
BITCOIN - BTC/USD - Daily - Technical analysis published on 05/13/2021 (GMT)
- 200
- 0
Click here for a new analysis!
- Timeframe : Daily
- - Analysis generated on
- Status : TARGET REACHED

Summary of the analysis

Additional analysis
Quotes
The BITCOIN - BTC/USD rating is 48,456.70 USD. The price is lower by -2.09% since the last closing with the lowest point at 46,444.60 USD and the highest point at 51,412.40 USD. The deviation from the price is +4.33% for the low point and -5.75% for the high point.So that you have an overall view of the price change, here is a table showing the variations over several periods:
Technical
Technical analysis of BITCOIN - BTC/USD in Daily shows an overall bearish trend. 67.86% of the signals given by moving averages are bearish. The overall trend is reinforced by the strong bearish signals from short-term moving averages. An assessment of moving averages reveals several bearish signals that could impact this trend:
Bearish trend reversal : adaptative moving average 50
Type : Bearish
Timeframe : Daily
Bearish trend reversal : adaptative moving average 100
Type : Bearish
Timeframe : Daily
Bearish price crossover with Moving Average 20
Type : Bearish
Timeframe : Daily
Bearish price crossover with Moving Average 100
Type : Bearish
Timeframe : Daily
Bearish price crossover with adaptative moving average 20
Type : Bearish
Timeframe : Daily
Bearish price crossover with adaptative moving average 50
Type : Bearish
Timeframe : Daily
Bearish price crossover with adaptative moving average 100
Type : Bearish
Timeframe : Daily
In fact, according to the parameters integrated into the Central Analyzer system, 11 technical indicators out of 18 analysed are currently bearish. But beware of excesses. The Central Indicators scanner currently detects this:
Williams %R indicator is oversold : under -80
Type : Neutral
Timeframe : Daily
Pivot points : price is under support 3
Type : Neutral
Timeframe : Weekly
RSI indicator is back under 50
Type : Bearish
Timeframe : Daily
MACD crosses DOWN its Moving Average
Type : Bearish
Timeframe : Daily
Ichimoku : price is under the cloud
Type : Bearish
Timeframe : Daily
MACD indicator is back under 0
Type : Bearish
Timeframe : Daily
Ichimoku - Bearish crossover : Tenkan & Kijun
Type : Bearish
Timeframe : Daily
Price is back under the pivot point
Type : Bearish
Timeframe : Daily
Momentum indicator is back under 0
Type : Bearish
Timeframe : Daily
Williams %R indicator is back under -50
Type : Bearish
Timeframe : Daily
The Central Patterns scanner, which studies chart patterns, resistances and supports, has identified this signal:
Support of channel is broken
Type : Bearish
Timeframe : Daily
The Central Candlesticks scanner which studies Japanese candlesticks did not detect anything.
| S3 | S2 | S1 | Price | R1 | R2 | |
|---|---|---|---|---|---|---|
| ProTrendLines | 19,345.50 | 30,409.80 | 40,672.60 | 48,456.70 | 53,277.80 | 61,170.60 |
| Change (%) | -60.08% | -37.24% | -16.06% | - | +9.95% | +26.24% |
| Change | -29,111.20 | -18,046.90 | -7,784.10 | - | +4,821.10 | +12,713.90 |
| Level | Major | Major | Intermediate | - | Major | Major |
Pivot points can also be used to set your price objectives. Here is the price situation in relation to pivot points:
| Pivot points | S3 | S2 | S1 | PP | R1 | R2 | R3 |
|---|---|---|---|---|---|---|---|
| Standard | 36,878.19 | 42,813.35 | 46,152.37 | 52,087.53 | 55,426.55 | 61,361.71 | 64,700.73 |
| Camarilla | 46,941.00 | 47,791.13 | 48,641.27 | 49,491.40 | 50,341.53 | 51,191.67 | 52,041.80 |
| Woodie | 35,580.13 | 42,164.32 | 44,854.31 | 51,438.50 | 54,128.49 | 60,712.68 | 63,402.67 |
| Fibonacci | 42,813.35 | 46,356.08 | 48,544.79 | 52,087.53 | 55,630.26 | 57,818.97 | 61,361.71 |
| Pivot points | S3 | S2 | S1 | PP | R1 | R2 | R3 |
|---|---|---|---|---|---|---|---|
| Standard | 48,360.57 | 50,719.84 | 54,839.45 | 57,198.72 | 61,318.33 | 63,677.60 | 67,797.21 |
| Camarilla | 57,177.38 | 57,771.28 | 58,365.17 | 58,959.07 | 59,552.97 | 60,146.87 | 60,740.76 |
| Woodie | 49,240.75 | 51,159.93 | 55,719.63 | 57,638.81 | 62,198.51 | 64,117.69 | 68,677.39 |
| Fibonacci | 50,719.84 | 53,194.77 | 54,723.79 | 57,198.72 | 59,673.65 | 61,202.67 | 63,677.60 |
| Pivot points | S3 | S2 | S1 | PP | R1 | R2 | R3 |
|---|---|---|---|---|---|---|---|
| Standard | 30,416.90 | 38,730.20 | 48,264.70 | 56,578.00 | 66,112.50 | 74,425.80 | 83,960.30 |
| Camarilla | 52,891.06 | 54,527.10 | 56,163.15 | 57,799.20 | 59,435.25 | 61,071.30 | 62,707.35 |
| Woodie | 31,027.50 | 39,035.50 | 48,875.30 | 56,883.30 | 66,723.10 | 74,731.10 | 84,570.90 |
| Fibonacci | 38,730.20 | 45,548.06 | 49,760.14 | 56,578.00 | 63,395.86 | 67,607.94 | 74,425.80 |
Numerical data
The following is the status of the technical indicators and moving averages at the time of publication of this technical analysis:
| RSI (14): | 36.28 | |
| MACD (12,26,9): | -900.5300 | |
| Directional Movement: | -19.51 | |
| AROON (14): | -21.43 | |
| DEMA (21): | 54,185.17 | |
| Parabolic SAR (0,02-0,02-0,2): | 59,157.53 | |
| Elder Ray (13): | -5,639.77 | |
| Super Trend (3,10): | 59,314.51 | |
| Zig ZAG (10): | 48,629.00 | |
| VORTEX (21): | 0.9500 | |
| Stochastique (14,3,5): | 27.58 | |
| TEMA (21): | 53,300.02 | |
| Williams %R (14): | -85.52 | |
| Chande Momentum Oscillator (20): | -9,486.40 | |
| Repulse (5,40,3): | -16.1000 | |
| ROCnROLL: | 2 | |
| TRIX (15,9): | -0.0700 | |
| Courbe Coppock: | 1.09 |
| MA7: | 54,940.96 | |
| MA20: | 54,928.38 | |
| MA50: | 56,602.53 | |
| MA100: | 53,654.63 | |
| MAexp7: | 53,242.29 | |
| MAexp20: | 55,093.21 | |
| MAexp50: | 55,133.97 | |
| MAexp100: | 51,180.77 | |
| Price / MA7: | -11.80% | |
| Price / MA20: | -11.78% | |
| Price / MA50: | -14.39% | |
| Price / MA100: | -9.69% | |
| Price / MAexp7: | -8.99% | |
| Price / MAexp20: | -12.05% | |
| Price / MAexp50: | -12.11% | |
| Price / MAexp100: | -5.32% |
About author

Online


Add a comment
Comments
0 comments on the analysis BITCOIN - BTC/USD - Daily