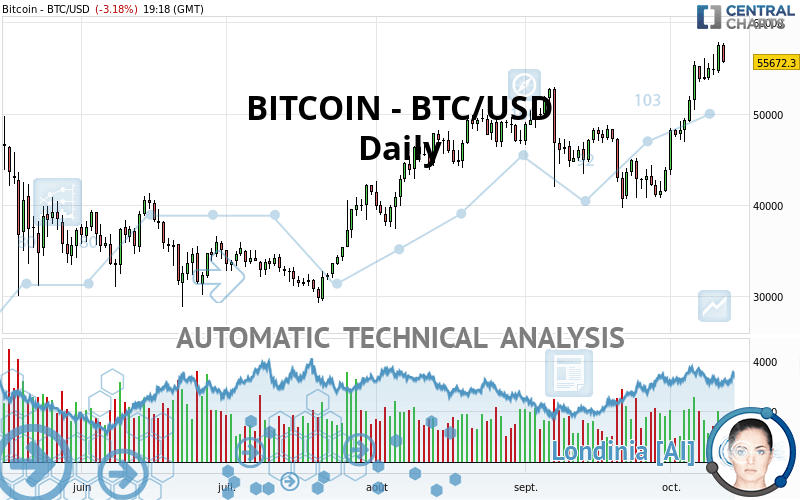
BITCOIN - BTC/USD - Daily - Technical analysis published on 10/12/2021 (GMT)
- 174
- 0
Click here for a new analysis!
- Timeframe : Daily
- - Analysis generated on
- Status : TARGET REACHED

Summary of the analysis

Additional analysis
Quotes
The BITCOIN - BTC/USD price is 55,672.30 USD. The price is lower by -3.18% since the last closing and was traded between 55,524.70 USD and 57,595.00 USD over the period. The price is currently at +0.27% from its lowest and -3.34% from its highest.A bearish opening was detected by the Central Gaps scanner. Sellers are trying to impose a bearish trend in the very short term.
Bearish opening
Type : Bearish
Timeframe : Openning
Here is a more detailed summary of the historical variations registered by BITCOIN - BTC/USD:
Near a new HIGH record (1 month)
Type : Bullish
Timeframe : Weekly
Technical
Technical analysis of BITCOIN - BTC/USD in Daily shows a strongly overall bullish trend. 92.86% of the signals given by moving averages are bullish. This strongly bullish trend is supported by the strong bullish signals given by short-term moving averages. An assessment of moving averages reveals a bullish signal that could impact this trend:
Moving Average bullish crossovers : MA20 & MA50
Type : Bullish
Timeframe : Daily
The probability of a further increase is high given the direction of the technical indicators.
Caution: the Central Indicators scanner currently detects an excess:
RSI indicator is overbought : over 70
Type : Neutral
Timeframe : Daily
CCI indicator is overbought : over 100
Type : Neutral
Timeframe : Daily
Williams %R indicator is overbought : over -20
Type : Neutral
Timeframe : Daily
Price is back over the pivot point
Type : Bullish
Timeframe : Daily
Price is back over the pivot point
Type : Bullish
Timeframe : Weekly
The Central Patterns scanner, which studies chart patterns, resistances and supports, has identified these signals:
Near resistance of channel
Type : Bearish
Timeframe : Daily
Near horizontal support
Type : Bullish
Timeframe : Daily
The presence of a bullish Japanese candlestick pattern detected by Central Candlesticks that could cause a very short term rebound was also detected:
Bullish engulfing lines
Type : Bullish
Timeframe : Daily
| S3 | S2 | S1 | Price | R1 | R2 | R3 | |
|---|---|---|---|---|---|---|---|
| ProTrendLines | 40,599.10 | 48,210.80 | 52,682.50 | 55,672.30 | 55,956.20 | 58,992.90 | 63,577.00 |
| Change (%) | -27.07% | -13.40% | -5.37% | - | +0.51% | +5.96% | +14.20% |
| Change | -15,073.20 | -7,461.50 | -2,989.80 | - | +283.90 | +3,320.60 | +7,904.70 |
| Level | Intermediate | Intermediate | Major | - | Intermediate | Intermediate | Major |
To determine price objectives, it is also possible to use the pivot points. Here is the price position in relation to pivot points:
| Pivot points | S3 | S2 | S1 | PP | R1 | R2 | R3 |
|---|---|---|---|---|---|---|---|
| Standard | 52,082.43 | 53,296.77 | 55,398.33 | 56,612.67 | 58,714.23 | 59,928.57 | 62,030.13 |
| Camarilla | 56,588.03 | 56,891.99 | 57,195.94 | 57,499.90 | 57,803.86 | 58,107.82 | 58,411.77 |
| Woodie | 52,526.05 | 53,518.58 | 55,841.95 | 56,834.48 | 59,157.85 | 60,150.38 | 62,473.75 |
| Fibonacci | 53,296.77 | 54,563.44 | 55,345.99 | 56,612.67 | 57,879.34 | 58,661.89 | 59,928.57 |
| Pivot points | S3 | S2 | S1 | PP | R1 | R2 | R3 |
|---|---|---|---|---|---|---|---|
| Standard | 40,105.27 | 43,522.73 | 49,243.87 | 52,661.33 | 58,382.47 | 61,799.93 | 67,521.07 |
| Camarilla | 52,451.89 | 53,289.59 | 54,127.30 | 54,965.00 | 55,802.71 | 56,640.41 | 57,478.12 |
| Woodie | 41,257.10 | 44,098.65 | 50,395.70 | 53,237.25 | 59,534.30 | 62,375.85 | 68,672.90 |
| Fibonacci | 43,522.73 | 47,013.68 | 49,170.39 | 52,661.33 | 56,152.28 | 58,308.99 | 61,799.93 |
| Pivot points | S3 | S2 | S1 | PP | R1 | R2 | R3 |
|---|---|---|---|---|---|---|---|
| Standard | 24,721.17 | 32,175.13 | 38,000.87 | 45,454.83 | 51,280.57 | 58,734.53 | 64,560.27 |
| Camarilla | 40,174.68 | 41,391.99 | 42,609.29 | 43,826.60 | 45,043.91 | 46,261.21 | 47,478.52 |
| Woodie | 23,907.05 | 31,768.08 | 37,186.75 | 45,047.78 | 50,466.45 | 58,327.48 | 63,746.15 |
| Fibonacci | 32,175.13 | 37,247.98 | 40,381.99 | 45,454.83 | 50,527.68 | 53,661.69 | 58,734.53 |
Numerical data
The following is the status of the technical indicators and moving averages at the time of publication of this technical analysis:
| RSI (14): | 64.80 | |
| MACD (12,26,9): | 2,802.3000 | |
| Directional Movement: | 20.85 | |
| AROON (14): | 85.72 | |
| DEMA (21): | 53,878.66 | |
| Parabolic SAR (0,02-0,02-0,2): | 49,890.35 | |
| Elder Ray (13): | 4,234.54 | |
| Super Trend (3,10): | 48,774.93 | |
| Zig ZAG (10): | 55,628.30 | |
| VORTEX (21): | 1.2900 | |
| Stochastique (14,3,5): | 91.33 | |
| TEMA (21): | 56,085.77 | |
| Williams %R (14): | -12.91 | |
| Chande Momentum Oscillator (20): | 11,799.60 | |
| Repulse (5,40,3): | 0.5800 | |
| ROCnROLL: | 1 | |
| TRIX (15,9): | 0.5100 | |
| Courbe Coppock: | 54.49 |
| MA7: | 55,133.54 | |
| MA20: | 48,648.66 | |
| MA50: | 47,866.82 | |
| MA100: | 43,558.39 | |
| MAexp7: | 54,501.22 | |
| MAexp20: | 50,733.34 | |
| MAexp50: | 47,814.39 | |
| MAexp100: | 45,669.14 | |
| Price / MA7: | +0.98% | |
| Price / MA20: | +14.44% | |
| Price / MA50: | +16.31% | |
| Price / MA100: | +27.81% | |
| Price / MAexp7: | +2.15% | |
| Price / MAexp20: | +9.74% | |
| Price / MAexp50: | +16.43% | |
| Price / MAexp100: | +21.90% |
About author

Online


Add a comment
Comments
0 comments on the analysis BITCOIN - BTC/USD - Daily