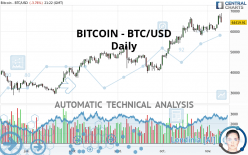
BITCOIN - BTC/USD - Daily - Technical analysis published on 11/10/2021 (GMT)
- Who voted?
- 216
- 0
Click here for a new analysis!
- Timeframe : Daily
- - Analysis generated on
- Status : INVALID

Summary of the analysis

Additional analysis
Quotes
The BITCOIN - BTC/USD price is 64,419.91 USD. The price registered a decrease of -3.76% on the session and was traded between 64,419.91 USD and 68,989.58 USD over the period. The price is currently at 0% from its lowest and -6.62% from its highest.The Central Gaps scanner detects a bullish opening. A small advantage for buyers in the very short term.
Bullish opening
Type : Bullish
Timeframe : Openning
A study of price movements over other periods shows the following variations:
New HIGH record (5 years)
Type : Bullish
Timeframe : Weekly
New HIGH record (1 month)
Type : Bullish
Timeframe : Weekly
Technical
A technical analysis in Daily of this BITCOIN - BTC/USD chart shows a strongly bullish trend. 92.86% of the signals given by moving averages are bullish. The overall trend is supported by the strong bullish signals from short-term moving averages. The Central Indicators market scanner currently does not detect any result that concerns moving averages.
The probability of a further increase is high given the direction of the technical indicators.
Caution: the Central Indicators scanner currently detects an excess:
CCI indicator is overbought : over 100
Type : Neutral
Timeframe : Daily
Previous candle closed over Bollinger bands
Type : Neutral
Timeframe : Daily
RSI indicator: bearish divergence
Type : Bearish
Timeframe : Daily
Williams %R indicator is overbought : over -20
Type : Neutral
Timeframe : Daily
Pivot points : price is over resistance 1
Type : Neutral
Timeframe : Weekly
Pivot points : price is under support 1
Type : Neutral
Timeframe : Daily
MACD crosses UP its Moving Average
Type : Bullish
Timeframe : Daily
Price is back under the pivot point
Type : Bearish
Timeframe : Weekly
Central Patterns, the market scanner focusing on chart patterns, resistances and supports found this result:
Resistance of channel is broken
Type : Bullish
Timeframe : Daily
Central Candlesticks, the scanner specialised in Japanese candlesticks, detects a bearish signal that could support the hypothesis of a small drop in the very short term:
Bearish harami
Type : Bearish
Timeframe : Daily
| S3 | S2 | S1 | Price | |
|---|---|---|---|---|
| ProTrendLines | 52,682.50 | 58,472.80 | 63,577.00 | 64,419.91 |
| Change (%) | -18.22% | -9.23% | -1.31% | - |
| Change | -11,737.41 | -5,947.11 | -842.91 | - |
| Level | Intermediate | Minor | Major | - |
Attention could also be paid to pivot points to set price objectives:
| Pivot points | S3 | S2 | S1 | PP | R1 | R2 | R3 |
|---|---|---|---|---|---|---|---|
| Standard | 63,819.71 | 65,070.20 | 66,001.97 | 67,252.46 | 68,184.23 | 69,434.72 | 70,366.49 |
| Camarilla | 66,333.61 | 66,533.65 | 66,733.69 | 66,933.73 | 67,133.77 | 67,333.81 | 67,533.85 |
| Woodie | 63,660.34 | 64,990.52 | 65,842.60 | 67,172.78 | 68,024.86 | 69,355.04 | 70,207.12 |
| Fibonacci | 65,070.20 | 65,903.83 | 66,418.84 | 67,252.46 | 68,086.09 | 68,601.10 | 69,434.72 |
| Pivot points | S3 | S2 | S1 | PP | R1 | R2 | R3 |
|---|---|---|---|---|---|---|---|
| Standard | 54,591.57 | 57,079.64 | 59,304.77 | 61,792.84 | 64,017.97 | 66,506.04 | 68,731.17 |
| Camarilla | 60,233.78 | 60,665.82 | 61,097.87 | 61,529.91 | 61,961.95 | 62,394.00 | 62,826.04 |
| Woodie | 54,460.11 | 57,013.91 | 59,173.31 | 61,727.11 | 63,886.51 | 66,440.31 | 68,599.71 |
| Fibonacci | 57,079.64 | 58,880.08 | 59,992.39 | 61,792.84 | 63,593.28 | 64,705.59 | 66,506.04 |
| Pivot points | S3 | S2 | S1 | PP | R1 | R2 | R3 |
|---|---|---|---|---|---|---|---|
| Standard | 23,786.63 | 33,544.97 | 47,457.73 | 57,216.07 | 71,128.83 | 80,887.17 | 94,799.93 |
| Camarilla | 54,860.95 | 57,030.80 | 59,200.65 | 61,370.50 | 63,540.35 | 65,710.20 | 67,880.05 |
| Woodie | 25,863.85 | 34,583.58 | 49,534.95 | 58,254.68 | 73,206.05 | 81,925.78 | 96,877.15 |
| Fibonacci | 33,544.97 | 42,587.33 | 48,173.71 | 57,216.07 | 66,258.43 | 71,844.81 | 80,887.17 |
Numerical data
The following is the status of the technical indicators and moving averages at the time of publication of this technical analysis:
| RSI (14): | 62.87 | |
| MACD (12,26,9): | 2,235.5900 | |
| Directional Movement: | 16.14 | |
| AROON (14): | 92.86 | |
| DEMA (21): | 65,520.23 | |
| Parabolic SAR (0,02-0,02-0,2): | 60,586.79 | |
| Elder Ray (13): | 3,554.39 | |
| Super Trend (3,10): | 59,372.75 | |
| Zig ZAG (10): | 65,918.72 | |
| VORTEX (21): | 1.0300 | |
| Stochastique (14,3,5): | 84.72 | |
| TEMA (21): | 65,275.10 | |
| Williams %R (14): | -29.49 | |
| Chande Momentum Oscillator (20): | 3,509.12 | |
| Repulse (5,40,3): | -0.1900 | |
| ROCnROLL: | 1 | |
| TRIX (15,9): | 0.5200 | |
| Courbe Coppock: | 10.67 |
| MA7: | 63,909.95 | |
| MA20: | 62,269.59 | |
| MA50: | 56,318.53 | |
| MA100: | 51,459.03 | |
| MAexp7: | 64,618.88 | |
| MAexp20: | 62,450.92 | |
| MAexp50: | 57,882.32 | |
| MAexp100: | 53,036.88 | |
| Price / MA7: | +0.80% | |
| Price / MA20: | +3.45% | |
| Price / MA50: | +14.38% | |
| Price / MA100: | +25.19% | |
| Price / MAexp7: | -0.31% | |
| Price / MAexp20: | +3.15% | |
| Price / MAexp50: | +11.29% | |
| Price / MAexp100: | +21.46% |
About author

Online


Add a comment
Comments
0 comments on the analysis BITCOIN - BTC/USD - Daily