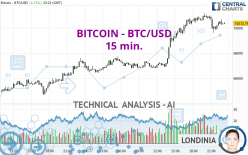
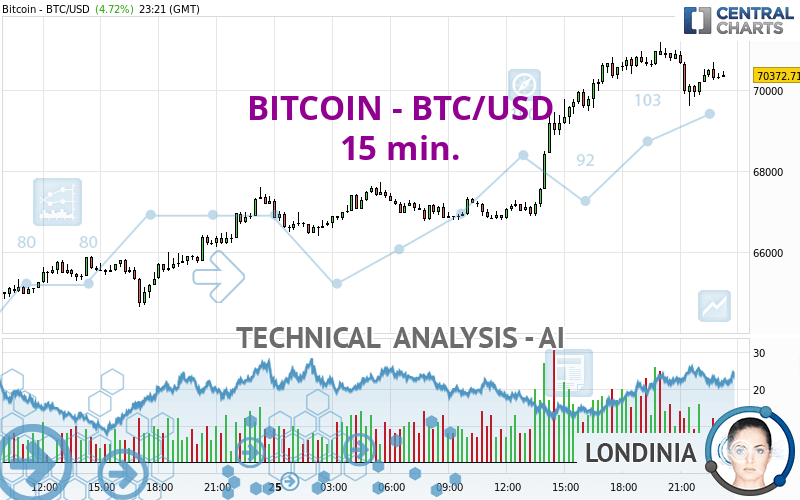
BITCOIN - BTC/USD - 15 min. - Technical analysis published on 03/25/2024 (GMT)
- 99
- 0
Click here for a new analysis!
- Timeframe : 15 min.
- - Analysis generated on
- Status : LEVEL MAINTAINED
Summary of the analysis

Additional analysis
Quotes
BITCOIN - BTC/USD rating 70,374.79 USD. On the day, this instrument gained +4.72% and was between 66,410.75 USD and 71,183.99 USD. This implies that the price is at +5.97% from its lowest and at -1.14% from its highest.The Central Gaps scanner detects a bullish opening marking the presence of buyers ahead of sellers at the opening but not sufficiently marked to allow the price to register a quotation gap.
Bullish opening
Type : Bullish
Timeframe : Openning
A study of price movements over other periods shows the following variations:
Near a new HIGH record (5 years)
Type : Bullish
Timeframe : Weekly
Near a new HIGH record (1 year)
Type : Bullish
Timeframe : Weekly
Near a new HIGH record (1st january)
Type : Bullish
Timeframe : Weekly
Near a new HIGH record (1 month)
Type : Bullish
Timeframe : Weekly
Technical
Technical analysis of BITCOIN - BTC/USD in 15 min. shows an overall bullish trend. 78.57% of the signals given by moving averages are bullish. Caution: the neutral signals currently given by short-term moving averages show us that the global trend is losing momentum. The Central Indicators market scanner is currently detecting several bearish and bullish signals that could impact this trend:
Bearish trend reversal : adaptative moving average 20
Type : Bearish
Timeframe : 15 minutes
Bullish price crossover with adaptative moving average 50
Type : Bullish
Timeframe : 15 minutes
An assessment of technical indicators does not currently provide any relevant information on the direction of future price movements.
Other results related to technical indicators were also found by the Central Indicators scanner:
Pivot points : price is over resistance 1
Type : Neutral
Timeframe : Weekly
Pivot points : price is over resistance 2
Type : Neutral
Timeframe : 15 minutes
Williams %R indicator is back over -50
Type : Bullish
Timeframe : 15 minutes
Central Patterns, the scanner specializing in chart patterns, did not identify any signals.
The Central Candlesticks scanner currently notes the presence of this pattern in Japanese candlesticks that could mark the end of the short-term trend currently underway:
Doji
Type : Neutral
Timeframe : 15 minutes
| S3 | S2 | S1 | Price | R1 | |
|---|---|---|---|---|---|
| ProTrendLines | 66,620.31 | 67,554.70 | 68,900.47 | 70,374.79 | 73,117.83 |
| Change (%) | -5.33% | -4.01% | -2.09% | - | +3.90% |
| Change | -3,754.48 | -2,820.09 | -1,474.32 | - | +2,743.04 |
| Level | Intermediate | Major | Intermediate | - | Major |
To determine price objectives, it is also possible to use the pivot points. Here is the price position in relation to pivot points:
| Pivot points | S3 | S2 | S1 | PP | R1 | R2 | R3 |
|---|---|---|---|---|---|---|---|
| Standard | 60,990.57 | 62,399.63 | 64,800.43 | 66,209.49 | 68,610.29 | 70,019.35 | 72,420.15 |
| Camarilla | 66,153.52 | 66,502.76 | 66,851.99 | 67,201.23 | 67,550.47 | 67,899.70 | 68,248.94 |
| Woodie | 61,486.44 | 62,647.57 | 65,296.30 | 66,457.43 | 69,106.16 | 70,267.29 | 72,916.02 |
| Fibonacci | 62,399.63 | 63,855.00 | 64,754.12 | 66,209.49 | 67,664.86 | 68,563.98 | 70,019.35 |
| Pivot points | S3 | S2 | S1 | PP | R1 | R2 | R3 |
|---|---|---|---|---|---|---|---|
| Standard | 52,100.97 | 56,443.50 | 60,226.87 | 64,569.40 | 68,352.77 | 72,695.30 | 76,478.67 |
| Camarilla | 61,775.63 | 62,520.50 | 63,265.38 | 64,010.25 | 64,755.12 | 65,500.00 | 66,244.87 |
| Woodie | 51,821.40 | 56,303.71 | 59,947.30 | 64,429.61 | 68,073.20 | 72,555.51 | 76,199.10 |
| Fibonacci | 56,443.50 | 59,547.59 | 61,465.30 | 64,569.40 | 67,673.49 | 69,591.20 | 72,695.30 |
| Pivot points | S3 | S2 | S1 | PP | R1 | R2 | R3 |
|---|---|---|---|---|---|---|---|
| Standard | 25,780.04 | 34,010.53 | 47,595.74 | 55,826.23 | 69,411.44 | 77,641.93 | 91,227.14 |
| Camarilla | 55,181.64 | 57,181.42 | 59,181.19 | 61,180.96 | 63,180.73 | 65,180.51 | 67,180.28 |
| Woodie | 28,457.41 | 35,349.21 | 50,273.11 | 57,164.91 | 72,088.81 | 78,980.61 | 93,904.51 |
| Fibonacci | 34,010.53 | 42,344.12 | 47,492.63 | 55,826.23 | 64,159.82 | 69,308.33 | 77,641.93 |
Numerical data
The following are the details of the technical indicators and moving averages that were collected to generate this technical analysis:
| RSI (14): | 52.19 | |
| MACD (12,26,9): | 177.6800 | |
| Directional Movement: | 4.19 | |
| AROON (14): | -35.71 | |
| DEMA (21): | 70,671.53 | |
| Parabolic SAR (0,02-0,02-0,2): | 70,682.17 | |
| Elder Ray (13): | -58.63 | |
| Super Trend (3,10): | 71,089.44 | |
| Zig ZAG (10): | 70,318.45 | |
| VORTEX (21): | 1.0000 | |
| Stochastique (14,3,5): | 53.49 | |
| TEMA (21): | 70,384.28 | |
| Williams %R (14): | -48.29 | |
| Chande Momentum Oscillator (20): | -410.97 | |
| Repulse (5,40,3): | 0.0100 | |
| ROCnROLL: | -1 | |
| TRIX (15,9): | 0.0600 | |
| Courbe Coppock: | 1.29 |
| MA7: | 65,810.28 | |
| MA20: | 67,908.64 | |
| MA50: | 59,049.38 | |
| MA100: | 50,978.38 | |
| MAexp7: | 70,384.90 | |
| MAexp20: | 70,327.77 | |
| MAexp50: | 69,581.03 | |
| MAexp100: | 68,528.86 | |
| Price / MA7: | +6.94% | |
| Price / MA20: | +3.63% | |
| Price / MA50: | +19.18% | |
| Price / MA100: | +38.05% | |
| Price / MAexp7: | -0.01% | |
| Price / MAexp20: | +0.07% | |
| Price / MAexp50: | +1.14% | |
| Price / MAexp100: | +2.69% |
About author

Online


Add a comment
Comments
0 comments on the analysis BITCOIN - BTC/USD - 15 min.