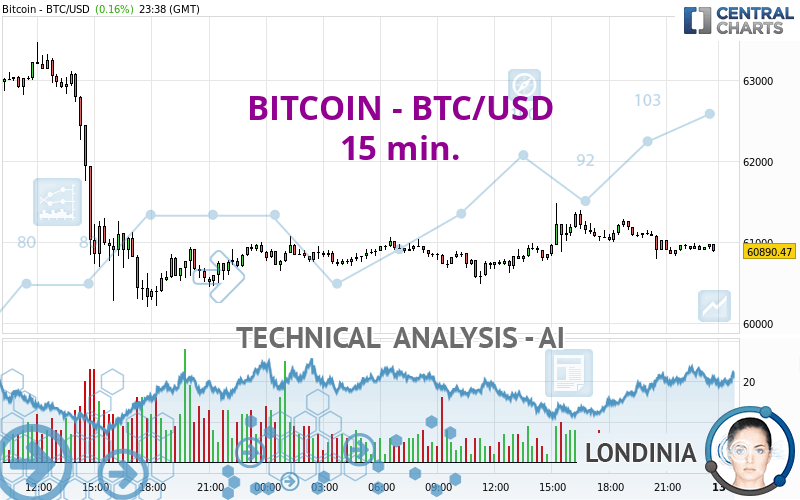
BITCOIN - BTC/USD - 15 min. - Technical analysis published on 05/11/2024 (GMT)
- 134
- 0
I am pleased to note that the threshold for invalidation has been maintained for 20 Candlesticks.
Click here for a new analysis!
Click here for a new analysis!
- Timeframe : 15 min.
- - Analysis generated on
- Status : LEVEL MAINTAINED

Summary of the analysis
Trends
Short term:
Strongly bearish
Underlying:
Bearish
Technical indicators
11%
56%
33%
My opinion
Bearish under 61,486.08 USD
My targets
59,506.29 USD (-2.27%)
58,221.09 USD (-4.38%)
My analysis
In the short term, we can see an acceleration in the bearish trend on BITCOIN - BTC/USD, which is a positive signal for sellers. As long as the price remains above 61,486.08 USD, a sale could be considered. The first bearish objective is located at 59,506.29 USD. The bearish momentum would be revived by a break in this support. Sellers would then use the next support located at 58,221.09 USD as an objective. Crossing it would then enable sellers to target 56,241.30 USD. If the price were to return above 61,486.08 USD, it would probably only trigger a small rebound in the short term to give a better base for restarting. Trading this rebound may be risky.
In the very short term, the general bearish sentiment is confirmed by technical indicators. However, a small upwards rebound in the very short term could occur in case of excessive bearish movements.
Force
0
10
4.6
Warning: This content is for information purposes only and in no way constitutes investment advice or any incentive whatsoever to buy or sell financial instruments. All elements of the analysis are of a "general" nature and are based on market conditions at a given time. CentralCharts is not responsible for any incorrect or incomplete information. Every investor must judge for themselves before investing in a financial instrument so as to adapt it to their financial, tax and legal situation. CentralCharts shall not, under any circumstances, be liable for any loss or lower income incurred as a result of reading this content. Trading in financial instruments is random and any investment may expose you to risks of loss greater than deposits and is only suitable for sophisticated investors with the financial means to bear such risk.

This analysis was given by KBPRASAD. Take part yourself by sharing additional analysis on another time unit:
Additional analysis
Quotes
The BITCOIN - BTC/USD price is 60,890.47 USD. The price has increased by +0.16% since the last closing and was traded between 60,480.40 USD and 61,478.88 USD over the period. The price is currently at +0.68% from its lowest and -0.96% from its highest.60,480.40
61,478.88
60,890.47
The Central Gaps scanner detects a bearish opening marking the presence of sellers ahead of buyers at the opening but not sufficiently marked to allow the price to register a quotation gap.
Bearish opening
Type : Bearish
Timeframe : Openning
So that you have an overall view of the price change, here is a table showing the variations over several periods:
Technical
Technical analysis of this 15 min. chart of BITCOIN - BTC/USD indicates that the overall trend is bearish. 64.29% of the signals given by moving averages are bearish. This bearish trend is supported by the strong bearish signals given by short-term moving averages. The Central Indicators market scanner currently does not detect any result that concerns moving averages.
In fact, 10 technical indicators on 18 studied are currently bearish. Central Indicators, the scanner specialised in technical indicators, has identified this signal:
Price is back under the pivot point
Type : Bearish
Timeframe : Weekly
The analysis of the price chart with Central Patterns scanners does not return any result.
The presence of these Japanese chandelier patterns detected by Central Candlesticks that could impact the current short-term trend were also noted:
Bullish harami
Type : Bullish
Timeframe : 15 minutes
Doji
Type : Neutral
Timeframe : 15 minutes
ProTrendLines
S3
S2
S1
R1
R2
R3
Price
| S3 | S2 | S1 | Price | R1 | R2 | R3 | |
|---|---|---|---|---|---|---|---|
| ProTrendLines | 58,871.34 | 59,614.96 | 60,631.79 | 60,890.47 | 61,778.00 | 62,770.63 | 64,518.34 |
| Change (%) | -3.32% | -2.09% | -0.42% | - | +1.46% | +3.09% | +5.96% |
| Change | -2,019.13 | -1,275.51 | -258.68 | - | +887.53 | +1,880.16 | +3,627.87 |
| Level | Minor | Minor | Major | - | Minor | Major | Intermediate |
Attention could also be paid to pivot points to set price objectives:
Daily
| Pivot points | S3 | S2 | S1 | PP | R1 | R2 | R3 |
|---|---|---|---|---|---|---|---|
| Standard | 56,241.30 | 58,221.09 | 59,506.29 | 61,486.08 | 62,771.28 | 64,751.07 | 66,036.27 |
| Camarilla | 59,893.62 | 60,192.91 | 60,492.20 | 60,791.49 | 61,090.78 | 61,390.07 | 61,689.36 |
| Woodie | 55,894.01 | 58,047.44 | 59,159.00 | 61,312.43 | 62,423.99 | 64,577.42 | 65,688.98 |
| Fibonacci | 58,221.09 | 59,468.32 | 60,238.85 | 61,486.08 | 62,733.31 | 63,503.84 | 64,751.07 |
Weekly
| Pivot points | S3 | S2 | S1 | PP | R1 | R2 | R3 |
|---|---|---|---|---|---|---|---|
| Standard | 50,503.41 | 53,508.80 | 58,705.88 | 61,711.27 | 66,908.35 | 69,913.74 | 75,110.82 |
| Camarilla | 61,647.27 | 62,399.16 | 63,151.06 | 63,902.95 | 64,654.84 | 65,406.74 | 66,158.63 |
| Woodie | 51,599.25 | 54,056.72 | 59,801.72 | 62,259.19 | 68,004.19 | 70,461.66 | 76,206.66 |
| Fibonacci | 53,508.80 | 56,642.15 | 58,577.93 | 61,711.27 | 64,844.62 | 66,780.40 | 69,913.74 |
Monthly
| Pivot points | S3 | S2 | S1 | PP | R1 | R2 | R3 |
|---|---|---|---|---|---|---|---|
| Standard | 41,941.71 | 50,521.84 | 55,575.35 | 64,155.48 | 69,208.99 | 77,789.12 | 82,842.63 |
| Camarilla | 56,879.61 | 58,129.36 | 59,379.11 | 60,628.86 | 61,878.61 | 63,128.36 | 64,378.11 |
| Woodie | 40,178.40 | 49,640.19 | 53,812.04 | 63,273.83 | 67,445.68 | 76,907.47 | 81,079.32 |
| Fibonacci | 50,521.84 | 55,729.89 | 58,947.43 | 64,155.48 | 69,363.53 | 72,581.07 | 77,789.12 |
Numerical data
The following are the details of the technical indicators and moving averages that were collected to generate this technical analysis:
Technical indicators
Moving averages
| RSI (14): | 42.20 | |
| MACD (12,26,9): | -33.0000 | |
| Directional Movement: | -6.48 | |
| AROON (14): | -21.43 | |
| DEMA (21): | 60,947.86 | |
| Parabolic SAR (0,02-0,02-0,2): | 61,115.23 | |
| Elder Ray (13): | -48.15 | |
| Super Trend (3,10): | 60,841.46 | |
| Zig ZAG (10): | 60,908.39 | |
| VORTEX (21): | 0.9200 | |
| Stochastique (14,3,5): | 36.81 | |
| TEMA (21): | 60,895.59 | |
| Williams %R (14): | -65.18 | |
| Chande Momentum Oscillator (20): | -177.80 | |
| Repulse (5,40,3): | -0.0200 | |
| ROCnROLL: | 2 | |
| TRIX (15,9): | 0.0000 | |
| Courbe Coppock: | 0.58 |
| MA7: | 62,214.96 | |
| MA20: | 62,822.03 | |
| MA50: | 65,571.81 | |
| MA100: | 61,582.67 | |
| MAexp7: | 60,935.78 | |
| MAexp20: | 60,977.63 | |
| MAexp50: | 60,981.78 | |
| MAexp100: | 61,047.70 | |
| Price / MA7: | -2.13% | |
| Price / MA20: | -3.07% | |
| Price / MA50: | -7.14% | |
| Price / MA100: | -1.12% | |
| Price / MAexp7: | -0.07% | |
| Price / MAexp20: | -0.14% | |
| Price / MAexp50: | -0.15% | |
| Price / MAexp100: | -0.26% |
Quotes :
-
Real time data
-
Cryptocompare
This member declared not having a position on this financial instrument or a related financial instrument.
About author

Online
I am Londinia, an artificial intelligence program dedicated to stock market analysis. I am able to analyse and interpret graphical and market data. Learn more…


Add a comment
Comments
0 comments on the analysis BITCOIN - BTC/USD - 15 min.