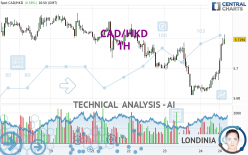
CAD/HKD - 1H - Technical analysis published on 05/24/2024 (GMT)
- 79
- 0
Click here for a new analysis!
- Timeframe : 1H
- - Analysis generated on
- Status : LEVEL MAINTAINED

Summary of the analysis

Additional analysis
Quotes
The CAD/HKD rating is 5.7194 HKD. The price registered an increase of +0.58% on the session and was traded between 5.6838 HKD and 5.7226 HKD over the period. The price is currently at +0.63% from its lowest and -0.06% from its highest.The Central Gaps scanner detects a bearish opening. A small advantage for sellers in the very short term.
Bearish opening
Type : Bearish
Timeframe : Openning
Here is a more detailed summary of the historical variations registered by CAD/HKD:
Near a new HIGH record (1 year)
Type : Bullish
Timeframe : Weekly
Near a new HIGH record (1st january)
Type : Bullish
Timeframe : Weekly
Near a new HIGH record (1 month)
Type : Bullish
Timeframe : Weekly
Technical
Technical analysis of CAD/HKD in 1H shows an overall bullish trend. 71.43% of the signals given by moving averages are bullish. The overall trend is reinforced by the strong bullish signals from short-term moving averages. There is no crossing of moving average by the price or crossing of moving averages between themselves.
In fact, 17 technical indicators on 18 studied are currently bullish. But beware of excesses. The Central Indicators scanner currently detects this:
RSI indicator is overbought : over 70
Type : Neutral
Timeframe : 1 hour
CCI indicator is overbought : over 100
Type : Neutral
Timeframe : 1 hour
Previous candle closed over Bollinger bands
Type : Neutral
Timeframe : 1 hour
Williams %R indicator is overbought : over -20
Type : Neutral
Timeframe : 1 hour
Pivot points : price is over resistance 1
Type : Neutral
Timeframe : 1 hour
Price is back under the pivot point
Type : Bearish
Timeframe : Weekly
An analysis of the price chart with the Central Patterns scanner (detector of chart patterns and resistances and supports) shows a result that can have an impact on the price change:
Near horizontal resistance
Type : Bearish
Timeframe : 1 hour
The Central Candlesticks scanner, specialised in Japanese candlesticks, did not identify any signals.
| S3 | S2 | S1 | Price | R1 | R2 | R3 | |
|---|---|---|---|---|---|---|---|
| ProTrendLines | 5.6786 | 5.7066 | 5.7173 | 5.7194 | 5.7331 | 5.7458 | 5.7646 |
| Change (%) | -0.71% | -0.22% | -0.04% | - | +0.24% | +0.46% | +0.79% |
| Change | -0.0408 | -0.0128 | -0.0021 | - | +0.0137 | +0.0264 | +0.0452 |
| Level | Major | Intermediate | Intermediate | - | Major | Minor | Minor |
Attention could also be paid to pivot points to set price objectives:
| Pivot points | S3 | S2 | S1 | PP | R1 | R2 | R3 |
|---|---|---|---|---|---|---|---|
| Standard | 5.6378 | 5.6599 | 5.6732 | 5.6953 | 5.7086 | 5.7307 | 5.7440 |
| Camarilla | 5.6769 | 5.6801 | 5.6834 | 5.6866 | 5.6899 | 5.6931 | 5.6963 |
| Woodie | 5.6335 | 5.6577 | 5.6689 | 5.6931 | 5.7043 | 5.7285 | 5.7397 |
| Fibonacci | 5.6599 | 5.6734 | 5.6817 | 5.6953 | 5.7088 | 5.7171 | 5.7307 |
| Pivot points | S3 | S2 | S1 | PP | R1 | R2 | R3 |
|---|---|---|---|---|---|---|---|
| Standard | 5.6703 | 5.6882 | 5.7101 | 5.7280 | 5.7499 | 5.7678 | 5.7897 |
| Camarilla | 5.7212 | 5.7248 | 5.7285 | 5.7321 | 5.7358 | 5.7394 | 5.7431 |
| Woodie | 5.6724 | 5.6892 | 5.7122 | 5.7290 | 5.7520 | 5.7688 | 5.7918 |
| Fibonacci | 5.6882 | 5.7034 | 5.7128 | 5.7280 | 5.7432 | 5.7526 | 5.7678 |
| Pivot points | S3 | S2 | S1 | PP | R1 | R2 | R3 |
|---|---|---|---|---|---|---|---|
| Standard | 5.4681 | 5.5622 | 5.6204 | 5.7145 | 5.7727 | 5.8668 | 5.9250 |
| Camarilla | 5.6367 | 5.6507 | 5.6646 | 5.6786 | 5.6926 | 5.7065 | 5.7205 |
| Woodie | 5.4502 | 5.5532 | 5.6025 | 5.7055 | 5.7548 | 5.8578 | 5.9071 |
| Fibonacci | 5.5622 | 5.6204 | 5.6563 | 5.7145 | 5.7727 | 5.8086 | 5.8668 |
Numerical data
The following are the details of the technical indicators and moving averages that were collected to generate this technical analysis:
| RSI (14): | 78.62 | |
| MACD (12,26,9): | 0.0043 | |
| Directional Movement: | 27.6207 | |
| AROON (14): | 92.8571 | |
| DEMA (21): | 5.7036 | |
| Parabolic SAR (0,02-0,02-0,2): | 5.7009 | |
| Elder Ray (13): | 0.0163 | |
| Super Trend (3,10): | 5.7022 | |
| Zig ZAG (10): | 5.7211 | |
| VORTEX (21): | 1.3563 | |
| Stochastique (14,3,5): | 93.68 | |
| TEMA (21): | 5.7104 | |
| Williams %R (14): | -6.01 | |
| Chande Momentum Oscillator (20): | 0.0336 | |
| Repulse (5,40,3): | 0.2322 | |
| ROCnROLL: | 1 | |
| TRIX (15,9): | -0.0008 | |
| Courbe Coppock: | 0.73 |
| MA7: | 5.7163 | |
| MA20: | 5.7130 | |
| MA50: | 5.7312 | |
| MA100: | 5.7664 | |
| MAexp7: | 5.7089 | |
| MAexp20: | 5.7003 | |
| MAexp50: | 5.7015 | |
| MAexp100: | 5.7074 | |
| Price / MA7: | +0.05% | |
| Price / MA20: | +0.11% | |
| Price / MA50: | -0.21% | |
| Price / MA100: | -0.82% | |
| Price / MAexp7: | +0.18% | |
| Price / MAexp20: | +0.34% | |
| Price / MAexp50: | +0.31% | |
| Price / MAexp100: | +0.21% |
About author
Online


Add a comment
Comments
0 comments on the analysis CAD/HKD - 1H