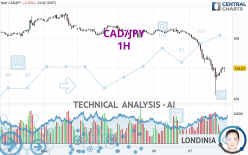
CAD/JPY - 1H - Technical analysis published on 12/07/2023 (GMT)
- 119
- 0
Click here for a new analysis!
- Timeframe : 1H
- - Analysis generated on
- Status : TARGET REACHED

Summary of the analysis

Additional analysis
Quotes
The CAD/JPY price is 106.01 JPY. On the day, this instrument lost -2.10% and was between 104.22 JPY and 108.29 JPY. This implies that the price is at +1.72% from its lowest and at -2.11% from its highest.A bullish opening was detected by the Central Gaps scanner. Buyers are trying to impose a bullish momentum in the very short term.
Bullish opening
Type : Bullish
Timeframe : Openning
Here is a more detailed summary of the historical variations registered by CAD/JPY:
Near a new HIGH record (5 years)
Type : Bullish
Timeframe : Weekly
Near a new HIGH record (1 year)
Type : Bullish
Timeframe : Weekly
Near a new HIGH record (1st january)
Type : Bullish
Timeframe : Weekly
Near a new HIGH record (1 month)
Type : Bullish
Timeframe : Weekly
New LOW record (1 month)
Type : Bearish
Timeframe : Weekly
Technical
Technical analysis of CAD/JPY in 1H shows a overall strongly bearish trend. 92.86% of the signals given by moving averages are bearish. The overall trend is supported by the strong bearish signals from short-term moving averages. There is no crossing of moving average by the price or crossing of moving averages between themselves.
The technical indicators are generally neutral. They do not provide relevant information on the direction of future price movements.
Other results related to technical indicators were also found by the Central Indicators scanner:
Pivot points : price is under support 3
Type : Neutral
Timeframe : 1 hour
Pivot points : price is under support 3
Type : Neutral
Timeframe : Weekly
MACD crosses UP its Moving Average
Type : Bullish
Timeframe : 1 hour
An analysis of the price chart with the Central Patterns scanner (detector of chart patterns and resistances and supports) shows several results that can have an impact on the price change:
Near horizontal support
Type : Bullish
Timeframe : 1 hour
Support of channel is broken
Type : Bearish
Timeframe : 1 hour
The Central Candlesticks scanner, specialised in Japanese candlesticks, did not identify any signals.
| S3 | S2 | S1 | Price | R1 | R2 | R3 | |
|---|---|---|---|---|---|---|---|
| ProTrendLines | 97.92 | 101.48 | 104.95 | 106.01 | 106.19 | 108.04 | 108.26 |
| Change (%) | -7.63% | -4.27% | -1.00% | - | +0.17% | +1.91% | +2.12% |
| Change | -8.09 | -4.53 | -1.06 | - | +0.18 | +2.03 | +2.25 |
| Level | Minor | Minor | Minor | - | Major | Major | Minor |
To determine price objectives, it is also possible to use the pivot points. Here is the price position in relation to pivot points:
| Pivot points | S3 | S2 | S1 | PP | R1 | R2 | R3 |
|---|---|---|---|---|---|---|---|
| Standard | 107.67 | 107.96 | 108.12 | 108.41 | 108.57 | 108.86 | 109.02 |
| Camarilla | 108.16 | 108.20 | 108.24 | 108.28 | 108.32 | 108.36 | 108.40 |
| Woodie | 107.61 | 107.93 | 108.06 | 108.38 | 108.51 | 108.83 | 108.96 |
| Fibonacci | 107.96 | 108.13 | 108.24 | 108.41 | 108.58 | 108.69 | 108.86 |
| Pivot points | S3 | S2 | S1 | PP | R1 | R2 | R3 |
|---|---|---|---|---|---|---|---|
| Standard | 106.29 | 107.17 | 108.01 | 108.89 | 109.73 | 110.61 | 111.45 |
| Camarilla | 108.37 | 108.53 | 108.68 | 108.84 | 109.00 | 109.16 | 109.31 |
| Woodie | 106.26 | 107.16 | 107.98 | 108.88 | 109.70 | 110.60 | 111.42 |
| Fibonacci | 107.17 | 107.83 | 108.24 | 108.89 | 109.55 | 109.96 | 110.61 |
| Pivot points | S3 | S2 | S1 | PP | R1 | R2 | R3 |
|---|---|---|---|---|---|---|---|
| Standard | 103.92 | 105.58 | 107.37 | 109.03 | 110.82 | 112.48 | 114.27 |
| Camarilla | 108.22 | 108.54 | 108.85 | 109.17 | 109.49 | 109.80 | 110.12 |
| Woodie | 104.00 | 105.61 | 107.45 | 109.06 | 110.90 | 112.51 | 114.35 |
| Fibonacci | 105.58 | 106.90 | 107.71 | 109.03 | 110.35 | 111.16 | 112.48 |
Numerical data
The following is the status of the technical indicators and moving averages at the time of publication of this technical analysis:
| RSI (14): | 31.85 | |
| MACD (12,26,9): | -0.5600 | |
| Directional Movement: | -33.60 | |
| AROON (14): | -57.14 | |
| DEMA (21): | 105.67 | |
| Parabolic SAR (0,02-0,02-0,2): | 104.33 | |
| Elder Ray (13): | -0.21 | |
| Super Trend (3,10): | 106.53 | |
| Zig ZAG (10): | 105.94 | |
| VORTEX (21): | 0.7400 | |
| Stochastique (14,3,5): | 63.17 | |
| TEMA (21): | 105.48 | |
| Williams %R (14): | -34.35 | |
| Chande Momentum Oscillator (20): | -0.76 | |
| Repulse (5,40,3): | 0.2300 | |
| ROCnROLL: | 2 | |
| TRIX (15,9): | -0.0800 | |
| Courbe Coppock: | 2.45 |
| MA7: | 108.22 | |
| MA20: | 108.89 | |
| MA50: | 109.06 | |
| MA100: | 108.54 | |
| MAexp7: | 105.92 | |
| MAexp20: | 106.42 | |
| MAexp50: | 107.24 | |
| MAexp100: | 107.82 | |
| Price / MA7: | -2.04% | |
| Price / MA20: | -2.64% | |
| Price / MA50: | -2.80% | |
| Price / MA100: | -2.33% | |
| Price / MAexp7: | +0.08% | |
| Price / MAexp20: | -0.39% | |
| Price / MAexp50: | -1.15% | |
| Price / MAexp100: | -1.68% |
News
Don't forget to follow the news on CAD/JPY. At the time of publication of this analysis, the latest news was as follows:
-
 CAD/JPY Forecast March 7, 2023
-
CAD/JPY Forecast October 4, 2022
-
CAD/JPY Forecast September 19, 2022
-
USDJPY and CADJPY Push Reversal Risk as S&P 500 Mocks Technical Levels
-
S&P 500 Breaks Resistance and Immediately Stalls as CADJPY Explodes Higher
About author

Online


Add a comment
Comments
0 comments on the analysis CAD/JPY - 1H