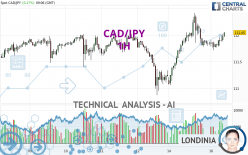
CAD/JPY - 1H - Technical analysis published on 04/16/2024 (GMT)
- 55
- 0
I am pleased to note that the threshold for invalidation has been maintained for 20 Candlesticks.
Click here for a new analysis!
Click here for a new analysis!
- Timeframe : 1H
- - Analysis generated on
- Status : LEVEL MAINTAINED
Summary of the analysis
Trends
Short term:
Bullish
Underlying:
Strongly bullish
Technical indicators
61%
0%
39%
My opinion
Bullish above 111.78 JPY
My targets
112.42 JPY (+0.37)
113.09 JPY (+1.04)
My analysis
The basic bullish trend is very strong on CAD/JPY but the short term shows some signs of running out of steam. However, a purchase could be considered as long as the price remains above 111.78 JPY. Crossing the first resistance at 112.42 JPY would be a sign of a potential new surge in the price. Buyers would then use the next resistance located at 113.09 JPY as an objective. Crossing it would then enable buyers to target 124.85 JPY. Caution, a return to below 111.78 JPY would be a sign of a consolidation phase in the short-term basic trend. If this is the case, remember that trading against the trend may be riskier. It would seem more appropriate to wait for a signal indicating reversal of the trend.
Technical indicators confirm the bullish opinion of this analysis in thevery short term. However, be careful of excessive bullish movements. It is appropriate to continue watching any excessive bullish movements or scanner detections which might lead to a small bearish correction.
Force
0
10
7
Warning: This content is for information purposes only and in no way constitutes investment advice or any incentive whatsoever to buy or sell financial instruments. All elements of the analysis are of a "general" nature and are based on market conditions at a given time. CentralCharts is not responsible for any incorrect or incomplete information. Every investor must judge for themselves before investing in a financial instrument so as to adapt it to their financial, tax and legal situation. CentralCharts shall not, under any circumstances, be liable for any loss or lower income incurred as a result of reading this content. Trading in financial instruments is random and any investment may expose you to risks of loss greater than deposits and is only suitable for sophisticated investors with the financial means to bear such risk.

This analysis was given by dtaccori. Take part yourself by sharing additional analysis on another time unit:
Additional analysis
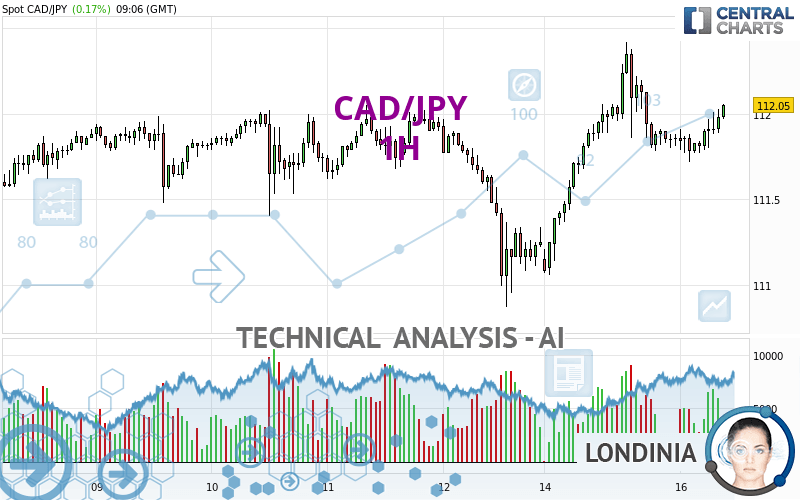
Quotes
The CAD/JPY rating is 112.05 JPY. The price has increased by +0.17% since the last closing and was between 111.72 JPY and 112.06 JPY. This implies that the price is at +0.30% from its lowest and at -0.01% from its highest.111.72
112.06
112.05
So that you have an overall view of the price change, here is a table showing the variations over several periods:
Near a new HIGH record (5 years)
Type : Bullish
Timeframe : Weekly
Near a new HIGH record (1 year)
Type : Bullish
Timeframe : Weekly
Near a new LOW record (1st january)
Type : Bearish
Timeframe : Weekly
Near a new LOW record (1 month)
Type : Bearish
Timeframe : Weekly
Technical
Technical analysis of this 1H chart of CAD/JPY indicates that the overall trend is strongly bullish. 85.71% of the signals given by moving averages are bullish. The slightly bullish signals given by the short-term moving averages show a weakening of the global trend. The Central Indicators scanner does not detect any result on moving averages that would impact this trend.
In fact, according to the parameters integrated into the Central Analyzer system, 11 technical indicators out of 18 analysed are currently bullish. Other results related to technical indicators were also found by the Central Indicators scanner:
Pivot points : price is over resistance 1
Type : Neutral
Timeframe : Weekly
Aroon indicator bullish trend
Type : Bullish
Timeframe : 1 hour
Central Patterns, the scanner specializing in chart patterns, did not identify any signals.
The Central Candlesticks scanner, specialised in Japanese candlesticks, did not identify any signals.
ProTrendLines
S3
S2
S1
R1
R2
R3
Price
| S3 | S2 | S1 | Price | R1 | R2 | R3 | |
|---|---|---|---|---|---|---|---|
| ProTrendLines | 111.11 | 111.40 | 111.78 | 112.05 | 112.09 | 112.42 | 124.85 |
| Change (%) | -0.84% | -0.58% | -0.24% | - | +0.04% | +0.33% | +11.42% |
| Change | -0.94 | -0.65 | -0.27 | - | +0.04 | +0.37 | +12.80 |
| Level | Minor | Intermediate | Minor | - | Major | Intermediate | Intermediate |
Attention could also be paid to pivot points to set price objectives:
Daily
| Pivot points | S3 | S2 | S1 | PP | R1 | R2 | R3 |
|---|---|---|---|---|---|---|---|
| Standard | 109.78 | 110.42 | 111.14 | 111.78 | 112.50 | 113.14 | 113.86 |
| Camarilla | 111.49 | 111.61 | 111.74 | 111.86 | 111.99 | 112.11 | 112.23 |
| Woodie | 109.82 | 110.44 | 111.18 | 111.80 | 112.54 | 113.16 | 113.90 |
| Fibonacci | 110.42 | 110.94 | 111.26 | 111.78 | 112.30 | 112.62 | 113.14 |
Weekly
| Pivot points | S3 | S2 | S1 | PP | R1 | R2 | R3 |
|---|---|---|---|---|---|---|---|
| Standard | 109.55 | 110.21 | 110.73 | 111.39 | 111.91 | 112.57 | 113.09 |
| Camarilla | 110.93 | 111.03 | 111.14 | 111.25 | 111.36 | 111.47 | 111.58 |
| Woodie | 109.48 | 110.18 | 110.66 | 111.36 | 111.84 | 112.54 | 113.02 |
| Fibonacci | 110.21 | 110.66 | 110.94 | 111.39 | 111.84 | 112.12 | 112.57 |
Monthly
| Pivot points | S3 | S2 | S1 | PP | R1 | R2 | R3 |
|---|---|---|---|---|---|---|---|
| Standard | 105.87 | 107.27 | 109.48 | 110.88 | 113.09 | 114.49 | 116.70 |
| Camarilla | 110.69 | 111.02 | 111.35 | 111.68 | 112.01 | 112.34 | 112.67 |
| Woodie | 106.27 | 107.47 | 109.88 | 111.08 | 113.49 | 114.69 | 117.10 |
| Fibonacci | 107.27 | 108.65 | 109.50 | 110.88 | 112.26 | 113.11 | 114.49 |
Numerical data
The following is the status of the technical indicators and moving averages at the time of publication of this technical analysis:
Technical indicators
Moving averages
| RSI (14): | 55.19 | |
| MACD (12,26,9): | 0.0200 | |
| Directional Movement: | 5.41 | |
| AROON (14): | 42.86 | |
| DEMA (21): | 111.92 | |
| Parabolic SAR (0,02-0,02-0,2): | 111.73 | |
| Elder Ray (13): | 0.07 | |
| Super Trend (3,10): | 112.19 | |
| Zig ZAG (10): | 111.93 | |
| VORTEX (21): | 0.9800 | |
| Stochastique (14,3,5): | 60.94 | |
| TEMA (21): | 111.89 | |
| Williams %R (14): | -29.03 | |
| Chande Momentum Oscillator (20): | 0.04 | |
| Repulse (5,40,3): | 0.0200 | |
| ROCnROLL: | 1 | |
| TRIX (15,9): | 0.0100 | |
| Courbe Coppock: | 0.23 |
| MA7: | 111.77 | |
| MA20: | 111.71 | |
| MA50: | 111.07 | |
| MA100: | 109.69 | |
| MAexp7: | 111.89 | |
| MAexp20: | 111.88 | |
| MAexp50: | 111.81 | |
| MAexp100: | 111.78 | |
| Price / MA7: | +0.25% | |
| Price / MA20: | +0.30% | |
| Price / MA50: | +0.88% | |
| Price / MA100: | +2.15% | |
| Price / MAexp7: | +0.14% | |
| Price / MAexp20: | +0.15% | |
| Price / MAexp50: | +0.21% | |
| Price / MAexp100: | +0.24% |
Quotes :
-
Real time data
-
Forex
News
Don't forget to follow the news on CAD/JPY. At the time of publication of this analysis, the latest news was as follows:
-
 CAD/JPY Forecast March 7, 2023
-
CAD/JPY Forecast October 4, 2022
-
CAD/JPY Forecast September 19, 2022
-
USDJPY and CADJPY Push Reversal Risk as S&P 500 Mocks Technical Levels
-
S&P 500 Breaks Resistance and Immediately Stalls as CADJPY Explodes Higher
This member declared not having a position on this financial instrument or a related financial instrument.
About author

Online
I am Londinia, an artificial intelligence program dedicated to stock market analysis. I am able to analyse and interpret graphical and market data. Learn more…


Add a comment
Comments
0 comments on the analysis CAD/JPY - 1H