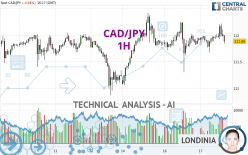
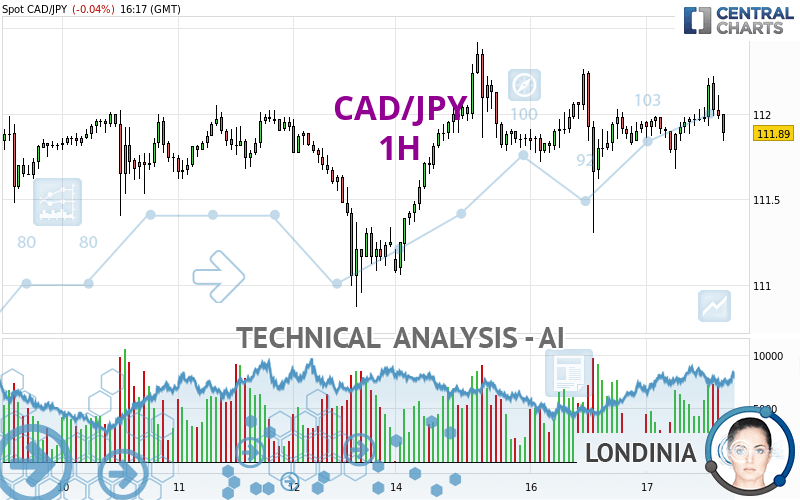
CAD/JPY - 1H - Technical analysis published on 04/17/2024 (GMT)
- 87
- 0
- Timeframe : 1H
- - Analysis generated on
- Status : NEUTRAL
Summary of the analysis

Additional analysis
Quotes
CAD/JPY rating 111.89 JPY. On the day, this instrument lost -0.05% and was traded between 111.68 JPY and 112.22 JPY over the period. The price is currently at +0.19% from its lowest and -0.29% from its highest.The Central Gaps scanner detects a bullish opening marking the presence of buyers ahead of sellers at the opening but not sufficiently marked to allow the price to register a quotation gap.
Bullish opening
Type : Bullish
Timeframe : Openning
So that you have an overall view of the price change, here is a table showing the variations over several periods:
Near a new HIGH record (5 years)
Type : Bullish
Timeframe : Weekly
Near a new HIGH record (1 year)
Type : Bullish
Timeframe : Weekly
Near a new LOW record (1st january)
Type : Bearish
Timeframe : Weekly
Near a new LOW record (1 month)
Type : Bearish
Timeframe : Weekly
Technical
Technical analysis of this 1H chart of CAD/JPY indicates that the overall trend is slightly bullish. 60.71% of the signals given by moving averages are bullish. Caution: the slightly bearish signals currently given by short-term moving averages indicate that the overall trend could be reversed. An assessment of moving averages reveals several bearish signals that could impact this trend:
Bearish price crossover with Moving Average 20
Type : Bearish
Timeframe : 1 hour
Bearish price crossover with Moving Average 50
Type : Bearish
Timeframe : 1 hour
Bearish price crossover with adaptative moving average 20
Type : Bearish
Timeframe : 1 hour
In fact, Central Analyzer took into account 18 technical indicators and the result was as follows: 5 are bullish, 10 are neutral and 3 are bearish. Other results related to technical indicators were also found by the Central Indicators scanner:
Pivot points : price is over resistance 1
Type : Neutral
Timeframe : Weekly
RSI indicator is back under 50
Type : Bearish
Timeframe : 1 hour
MACD crosses DOWN its Moving Average
Type : Bearish
Timeframe : 1 hour
Momentum indicator is back under 0
Type : Bearish
Timeframe : 1 hour
Williams %R indicator is back under -50
Type : Bearish
Timeframe : 1 hour
Central Patterns, the market scanner focusing on chart patterns, resistances and supports found these results:
Near horizontal resistance
Type : Bearish
Timeframe : 1 hour
Resistance of channel is broken
Type : Bullish
Timeframe : 1 hour
The Central Candlesticks scanner which studies Japanese candlesticks did not detect anything.
| S3 | S2 | S1 | Price | R1 | R2 | R3 | |
|---|---|---|---|---|---|---|---|
| ProTrendLines | 111.11 | 111.40 | 111.78 | 111.89 | 112.09 | 112.26 | 112.42 |
| Change (%) | -0.70% | -0.44% | -0.10% | - | +0.18% | +0.33% | +0.47% |
| Change | -0.78 | -0.49 | -0.11 | - | +0.20 | +0.37 | +0.53 |
| Level | Minor | Major | Minor | - | Major | Minor | Minor |
Attention could also be paid to pivot points to set price objectives:
| Pivot points | S3 | S2 | S1 | PP | R1 | R2 | R3 |
|---|---|---|---|---|---|---|---|
| Standard | 110.45 | 110.87 | 111.41 | 111.83 | 112.37 | 112.79 | 113.33 |
| Camarilla | 111.68 | 111.76 | 111.85 | 111.94 | 112.03 | 112.12 | 112.20 |
| Woodie | 110.50 | 110.90 | 111.46 | 111.86 | 112.42 | 112.82 | 113.38 |
| Fibonacci | 110.87 | 111.24 | 111.47 | 111.83 | 112.20 | 112.43 | 112.79 |
| Pivot points | S3 | S2 | S1 | PP | R1 | R2 | R3 |
|---|---|---|---|---|---|---|---|
| Standard | 109.55 | 110.21 | 110.73 | 111.39 | 111.91 | 112.57 | 113.09 |
| Camarilla | 110.93 | 111.03 | 111.14 | 111.25 | 111.36 | 111.47 | 111.58 |
| Woodie | 109.48 | 110.18 | 110.66 | 111.36 | 111.84 | 112.54 | 113.02 |
| Fibonacci | 110.21 | 110.66 | 110.94 | 111.39 | 111.84 | 112.12 | 112.57 |
| Pivot points | S3 | S2 | S1 | PP | R1 | R2 | R3 |
|---|---|---|---|---|---|---|---|
| Standard | 105.87 | 107.27 | 109.48 | 110.88 | 113.09 | 114.49 | 116.70 |
| Camarilla | 110.69 | 111.02 | 111.35 | 111.68 | 112.01 | 112.34 | 112.67 |
| Woodie | 106.27 | 107.47 | 109.88 | 111.08 | 113.49 | 114.69 | 117.10 |
| Fibonacci | 107.27 | 108.65 | 109.50 | 110.88 | 112.26 | 113.11 | 114.49 |
Numerical data
The following is the status of the technical indicators and moving averages at the time of publication of this technical analysis:
| RSI (14): | 49.05 | |
| MACD (12,26,9): | 0.0300 | |
| Directional Movement: | -2.93 | |
| AROON (14): | 57.14 | |
| DEMA (21): | 111.99 | |
| Parabolic SAR (0,02-0,02-0,2): | 111.68 | |
| Elder Ray (13): | -0.04 | |
| Super Trend (3,10): | 112.19 | |
| Zig ZAG (10): | 111.85 | |
| VORTEX (21): | 0.9800 | |
| Stochastique (14,3,5): | 51.85 | |
| TEMA (21): | 112.00 | |
| Williams %R (14): | -59.26 | |
| Chande Momentum Oscillator (20): | 0.00 | |
| Repulse (5,40,3): | -0.1300 | |
| ROCnROLL: | -1 | |
| TRIX (15,9): | 0.0000 | |
| Courbe Coppock: | 0.14 |
| MA7: | 111.78 | |
| MA20: | 111.72 | |
| MA50: | 111.11 | |
| MA100: | 109.72 | |
| MAexp7: | 111.98 | |
| MAexp20: | 111.96 | |
| MAexp50: | 111.91 | |
| MAexp100: | 111.86 | |
| Price / MA7: | +0.10% | |
| Price / MA20: | +0.15% | |
| Price / MA50: | +0.70% | |
| Price / MA100: | +1.98% | |
| Price / MAexp7: | -0.08% | |
| Price / MAexp20: | -0.06% | |
| Price / MAexp50: | -0.02% | |
| Price / MAexp100: | +0.03% |
News
The latest news and videos published on CAD/JPY at the time of the analysis were as follows:
-
 CAD/JPY Forecast March 7, 2023
-
CAD/JPY Forecast October 4, 2022
-
CAD/JPY Forecast September 19, 2022
-
USDJPY and CADJPY Push Reversal Risk as S&P 500 Mocks Technical Levels
-
S&P 500 Breaks Resistance and Immediately Stalls as CADJPY Explodes Higher
About author

Online


Add a comment
Comments
0 comments on the analysis CAD/JPY - 1H