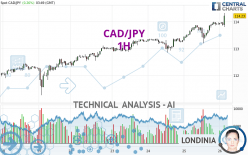
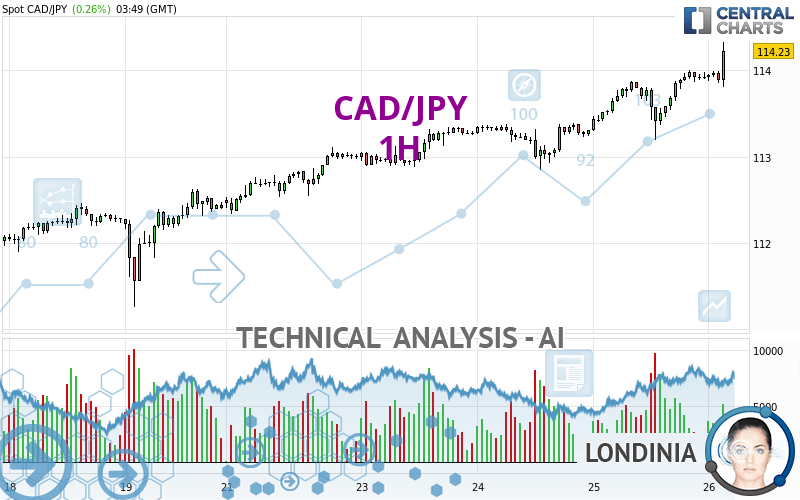
CAD/JPY - 1H - Technical analysis published on 04/26/2024 (GMT)
- 60
- 0
Click here for a new analysis!
- Timeframe : 1H
- - Analysis generated on
- Status : TARGET REACHED
Summary of the analysis

Additional analysis
Quotes
The CAD/JPY rating is 114.23 JPY. The price registered an increase of +0.26% on the session and was traded between 113.81 JPY and 114.33 JPY over the period. The price is currently at +0.37% from its lowest and -0.09% from its highest.A study of price movements over other periods shows the following variations:
New HIGH record (5 years)
Type : Bullish
Timeframe : Weekly
New HIGH record (1 year)
Type : Bullish
Timeframe : Weekly
New HIGH record (1st january)
Type : Bullish
Timeframe : Weekly
New HIGH record (1 month)
Type : Bullish
Timeframe : Weekly
Technical
A technical analysis in 1H of this CAD/JPY chart shows a strongly bullish trend. 92.86% of the signals given by moving averages are bullish. The overall trend is supported by the strong bullish signals from short-term moving averages. There is no crossing of moving average by the price or crossing of moving averages between themselves.
An assessment of technical indicators shows a strong bullish signal.
Caution: the Central Indicators scanner currently detects an excess:
RSI indicator is overbought : over 70
Type : Neutral
Timeframe : 1 hour
CCI indicator is overbought : over 100
Type : Neutral
Timeframe : 1 hour
Williams %R indicator is overbought : over -20
Type : Neutral
Timeframe : 1 hour
Pivot points : price is over resistance 1
Type : Neutral
Timeframe : 1 hour
Pivot points : price is over resistance 2
Type : Neutral
Timeframe : Weekly
MACD crosses UP its Moving Average
Type : Bullish
Timeframe : 1 hour
The Central Patterns scanner, which studies chart patterns, resistances and supports, has identified these signals:
Near horizontal resistance
Type : Bearish
Timeframe : 1 hour
Resistance of channel is broken
Type : Bullish
Timeframe : 1 hour
For a small rebound in the very short term, the Central Candlesticks scanner currently notes the presence of this bullish pattern in Japanese candlesticks:
Long white line
Type : Bullish
Timeframe : 1 hour
| S3 | S2 | S1 | Price | R1 | |
|---|---|---|---|---|---|
| ProTrendLines | 112.09 | 113.20 | 113.88 | 114.23 | 124.85 |
| Change (%) | -1.87% | -0.90% | -0.31% | - | +9.30% |
| Change | -2.14 | -1.03 | -0.35 | - | +10.62 |
| Level | Major | Intermediate | Minor | - | Intermediate |
Attention could also be paid to pivot points to set price objectives:
| Pivot points | S3 | S2 | S1 | PP | R1 | R2 | R3 |
|---|---|---|---|---|---|---|---|
| Standard | 112.61 | 112.90 | 113.42 | 113.71 | 114.23 | 114.52 | 115.04 |
| Camarilla | 113.71 | 113.78 | 113.86 | 113.93 | 114.00 | 114.08 | 114.15 |
| Woodie | 112.72 | 112.96 | 113.53 | 113.77 | 114.34 | 114.58 | 115.15 |
| Fibonacci | 112.90 | 113.21 | 113.40 | 113.71 | 114.02 | 114.21 | 114.52 |
| Pivot points | S3 | S2 | S1 | PP | R1 | R2 | R3 |
|---|---|---|---|---|---|---|---|
| Standard | 109.87 | 110.46 | 111.44 | 112.03 | 113.01 | 113.60 | 114.58 |
| Camarilla | 111.98 | 112.12 | 112.27 | 112.41 | 112.55 | 112.70 | 112.84 |
| Woodie | 110.06 | 110.56 | 111.63 | 112.13 | 113.20 | 113.70 | 114.77 |
| Fibonacci | 110.46 | 111.06 | 111.43 | 112.03 | 112.63 | 113.00 | 113.60 |
| Pivot points | S3 | S2 | S1 | PP | R1 | R2 | R3 |
|---|---|---|---|---|---|---|---|
| Standard | 105.87 | 107.27 | 109.48 | 110.88 | 113.09 | 114.49 | 116.70 |
| Camarilla | 110.69 | 111.02 | 111.35 | 111.68 | 112.01 | 112.34 | 112.67 |
| Woodie | 106.27 | 107.47 | 109.88 | 111.08 | 113.49 | 114.69 | 117.10 |
| Fibonacci | 107.27 | 108.65 | 109.50 | 110.88 | 112.26 | 113.11 | 114.49 |
Numerical data
The following is the status of the technical indicators and moving averages at the time of publication of this technical analysis:
| RSI (14): | 71.98 | |
| MACD (12,26,9): | 0.1500 | |
| Directional Movement: | 18.04 | |
| AROON (14): | 100.00 | |
| DEMA (21): | 114.03 | |
| Parabolic SAR (0,02-0,02-0,2): | 113.61 | |
| Elder Ray (13): | 0.15 | |
| Super Trend (3,10): | 113.59 | |
| Zig ZAG (10): | 114.32 | |
| VORTEX (21): | 1.0400 | |
| Stochastique (14,3,5): | 91.33 | |
| TEMA (21): | 114.07 | |
| Williams %R (14): | -4.17 | |
| Chande Momentum Oscillator (20): | 0.71 | |
| Repulse (5,40,3): | 0.4800 | |
| ROCnROLL: | 1 | |
| TRIX (15,9): | 0.0200 | |
| Courbe Coppock: | 0.62 |
| MA7: | 113.21 | |
| MA20: | 112.28 | |
| MA50: | 111.40 | |
| MA100: | 110.04 | |
| MAexp7: | 114.00 | |
| MAexp20: | 113.84 | |
| MAexp50: | 113.59 | |
| MAexp100: | 113.27 | |
| Price / MA7: | +0.90% | |
| Price / MA20: | +1.74% | |
| Price / MA50: | +2.54% | |
| Price / MA100: | +3.81% | |
| Price / MAexp7: | +0.20% | |
| Price / MAexp20: | +0.34% | |
| Price / MAexp50: | +0.56% | |
| Price / MAexp100: | +0.85% |
News
The last news published on CAD/JPY at the time of the generation of this analysis was as follows:
-
 CAD/JPY Forecast March 7, 2023
-
CAD/JPY Forecast October 4, 2022
-
CAD/JPY Forecast September 19, 2022
-
USDJPY and CADJPY Push Reversal Risk as S&P 500 Mocks Technical Levels
-
S&P 500 Breaks Resistance and Immediately Stalls as CADJPY Explodes Higher
About author

Online


Add a comment
Comments
0 comments on the analysis CAD/JPY - 1H