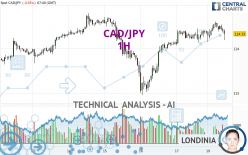
CAD/JPY - 1H - Technical analysis published on 05/20/2024 (GMT)
- 65
- 0
- Timeframe : 1H
- - Analysis generated on
- Status : NEUTRAL

Summary of the analysis

Additional analysis
Quotes
The CAD/JPY rating is 114.33 JPY. The price registered a decrease of -0.03% on the session with the lowest point at 114.15 JPY and the highest point at 114.61 JPY. The deviation from the price is +0.16% for the low point and -0.24% for the high point.The Central Gaps scanner detects a bullish opening. A small advantage for buyers in the very short term.
Bullish opening
Type : Bullish
Timeframe : Openning
So that you have an overall view of the price change, here is a table showing the variations over several periods:
Near a new HIGH record (5 years)
Type : Bullish
Timeframe : Weekly
Near a new HIGH record (1 year)
Type : Bullish
Timeframe : Weekly
Near a new HIGH record (1st january)
Type : Bullish
Timeframe : Weekly
Near a new HIGH record (1 month)
Type : Bullish
Timeframe : Weekly
Technical
Technical analysis of CAD/JPY in 1H shows an overall slightly bullish trend. 53.57% of the signals given by moving averages are bullish. As the signals currently given by short-term moving averages are rather neutral, the slightly bullish trend could return to neutral. The Central Indicators scanner detects bullish and bearish signals on moving averages that could impact this trend:
Moving Average bullish crossovers : MA50 & MA100
Type : Bullish
Timeframe : 1 hour
Bearish price crossover with Moving Average 20
Type : Bearish
Timeframe : 1 hour
Bearish price crossover with adaptative moving average 20
Type : Bearish
Timeframe : 1 hour
Bearish price crossover with adaptative moving average 100
Type : Bearish
Timeframe : 1 hour
An assessment of technical indicators shows a slightly bearish signal.
Central Indicators, the detector scanner for these technical indicators has recently detected several signals:
RSI indicator is back under 50
Type : Bearish
Timeframe : 1 hour
Parabolic SAR indicator bearish reversal
Type : Bearish
Timeframe : 1 hour
Price is back under the pivot point
Type : Bearish
Timeframe : 1 hour
Momentum indicator is back under 0
Type : Bearish
Timeframe : 1 hour
Williams %R indicator is back under -50
Type : Bearish
Timeframe : 1 hour
An analysis of the price chart with the Central Patterns scanner (detector of chart patterns and resistances and supports) shows several results that can have an impact on the price change:
Near horizontal resistance
Type : Bearish
Timeframe : 1 hour
Resistance of channel is broken
Type : Bullish
Timeframe : 1 hour
The Central Candlesticks scanner which studies Japanese candlesticks did not detect anything.
| S3 | S2 | S1 | Price | R1 | R2 | R3 | |
|---|---|---|---|---|---|---|---|
| ProTrendLines | 113.42 | 113.76 | 114.24 | 114.33 | 114.42 | 114.80 | 115.82 |
| Change (%) | -0.80% | -0.50% | -0.08% | - | +0.08% | +0.41% | +1.30% |
| Change | -0.91 | -0.57 | -0.09 | - | +0.09 | +0.47 | +1.49 |
| Level | Minor | Minor | Intermediate | - | Intermediate | Minor | Intermediate |
Pivot points can also be used to set your price objectives. Here is the price situation in relation to pivot points:
| Pivot points | S3 | S2 | S1 | PP | R1 | R2 | R3 |
|---|---|---|---|---|---|---|---|
| Standard | 113.76 | 113.91 | 114.14 | 114.29 | 114.52 | 114.67 | 114.90 |
| Camarilla | 114.26 | 114.29 | 114.33 | 114.36 | 114.40 | 114.43 | 114.47 |
| Woodie | 113.79 | 113.93 | 114.17 | 114.31 | 114.55 | 114.69 | 114.93 |
| Fibonacci | 113.91 | 114.06 | 114.15 | 114.29 | 114.44 | 114.53 | 114.67 |
| Pivot points | S3 | S2 | S1 | PP | R1 | R2 | R3 |
|---|---|---|---|---|---|---|---|
| Standard | 111.42 | 112.19 | 113.27 | 114.04 | 115.12 | 115.89 | 116.97 |
| Camarilla | 113.85 | 114.02 | 114.19 | 114.36 | 114.53 | 114.70 | 114.87 |
| Woodie | 111.59 | 112.27 | 113.44 | 114.12 | 115.29 | 115.97 | 117.14 |
| Fibonacci | 112.19 | 112.89 | 113.33 | 114.04 | 114.74 | 115.18 | 115.89 |
| Pivot points | S3 | S2 | S1 | PP | R1 | R2 | R3 |
|---|---|---|---|---|---|---|---|
| Standard | 104.68 | 107.77 | 111.14 | 114.23 | 117.60 | 120.69 | 124.06 |
| Camarilla | 112.72 | 113.32 | 113.91 | 114.50 | 115.09 | 115.68 | 116.28 |
| Woodie | 104.81 | 107.84 | 111.27 | 114.30 | 117.73 | 120.76 | 124.19 |
| Fibonacci | 107.77 | 110.24 | 111.77 | 114.23 | 116.70 | 118.23 | 120.69 |
Numerical data
The following is the status of the technical indicators and moving averages at the time of publication of this technical analysis:
| RSI (14): | 44.15 | |
| MACD (12,26,9): | 0.0600 | |
| Directional Movement: | -10.48 | |
| AROON (14): | 35.71 | |
| DEMA (21): | 114.47 | |
| Parabolic SAR (0,02-0,02-0,2): | 114.61 | |
| Elder Ray (13): | -0.09 | |
| Super Trend (3,10): | 114.13 | |
| Zig ZAG (10): | 114.28 | |
| VORTEX (21): | 0.9900 | |
| Stochastique (14,3,5): | 47.10 | |
| TEMA (21): | 114.44 | |
| Williams %R (14): | -73.91 | |
| Chande Momentum Oscillator (20): | -0.09 | |
| Repulse (5,40,3): | -0.1700 | |
| ROCnROLL: | -1 | |
| TRIX (15,9): | 0.0100 | |
| Courbe Coppock: | 0.18 |
| MA7: | 114.16 | |
| MA20: | 113.70 | |
| MA50: | 112.36 | |
| MA100: | 111.14 | |
| MAexp7: | 114.40 | |
| MAexp20: | 114.38 | |
| MAexp50: | 114.25 | |
| MAexp100: | 114.13 | |
| Price / MA7: | +0.15% | |
| Price / MA20: | +0.55% | |
| Price / MA50: | +1.75% | |
| Price / MA100: | +2.87% | |
| Price / MAexp7: | -0.06% | |
| Price / MAexp20: | -0.04% | |
| Price / MAexp50: | +0.07% | |
| Price / MAexp100: | +0.18% |
News
The last news published on CAD/JPY at the time of the generation of this analysis was as follows:
-
 CAD/JPY Forecast March 7, 2023
-
CAD/JPY Forecast October 4, 2022
-
CAD/JPY Forecast September 19, 2022
-
USDJPY and CADJPY Push Reversal Risk as S&P 500 Mocks Technical Levels
-
S&P 500 Breaks Resistance and Immediately Stalls as CADJPY Explodes Higher
About author

Online


Add a comment
Comments
0 comments on the analysis CAD/JPY - 1H