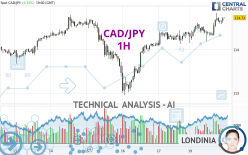
CAD/JPY - 1H - Technical analysis published on 05/20/2024 (GMT)
- 75
- 0
Click here for a new analysis!
- Timeframe : 1H
- - Analysis generated on
- Status : INVALID

Summary of the analysis

Additional analysis
Quotes
CAD/JPY rating 114.73 JPY. The price has increased by +0.32% since the last closing with the lowest point at 114.15 JPY and the highest point at 114.84 JPY. The deviation from the price is +0.51% for the low point and -0.10% for the high point.A bullish opening was detected by the Central Gaps scanner. Buyers are trying to impose a bullish momentum in the very short term.
Bullish opening
Type : Bullish
Timeframe : Openning
Here is a more detailed summary of the historical variations registered by CAD/JPY:
Near a new HIGH record (5 years)
Type : Bullish
Timeframe : Weekly
Near a new HIGH record (1 year)
Type : Bullish
Timeframe : Weekly
Near a new HIGH record (1st january)
Type : Bullish
Timeframe : Weekly
Near a new LOW record (1 month)
Type : Bearish
Timeframe : Weekly
Technical
A technical analysis in 1H of this CAD/JPY chart shows a strongly bullish trend. The signals given by the moving averages are 92.86% bullish. This strong bullish trend is confirmed by the strong signals currently being given by short-term moving averages. The Central Indicators scanner detects a bullish signal on moving averages that could impact this trend:
Bullish trend reversal : Moving Average 100
Type : Bullish
Timeframe : 1 hour
In fact, according to the parameters integrated into the Central Analyzer system, 14 technical indicators out of 18 analysed are currently bullish. Caution: the Central Indicators scanner currently detects an excess:
CCI indicator is overbought : over 100
Type : Neutral
Timeframe : 1 hour
Williams %R indicator is overbought : over -20
Type : Neutral
Timeframe : 1 hour
Pivot points : price is over resistance 2
Type : Neutral
Timeframe : 1 hour
The Central Patterns scanner, which studies chart patterns, resistances and supports, has identified these signals:
Near horizontal resistance
Type : Bearish
Timeframe : 1 hour
Resistance of channel is broken
Type : Bullish
Timeframe : 1 hour
No result was found by the Central Candlesticks scanner on Japanese candlesticks.
| S3 | S2 | S1 | Price | R1 | R2 | R3 | |
|---|---|---|---|---|---|---|---|
| ProTrendLines | 113.76 | 114.24 | 114.42 | 114.73 | 114.80 | 115.82 | 124.85 |
| Change (%) | -0.85% | -0.43% | -0.27% | - | +0.06% | +0.95% | +8.82% |
| Change | -0.97 | -0.49 | -0.31 | - | +0.07 | +1.09 | +10.12 |
| Level | Minor | Intermediate | Intermediate | - | Minor | Intermediate | Intermediate |
Pivot points can also be used to set your price objectives. Here is the price situation in relation to pivot points:
| Pivot points | S3 | S2 | S1 | PP | R1 | R2 | R3 |
|---|---|---|---|---|---|---|---|
| Standard | 113.76 | 113.91 | 114.14 | 114.29 | 114.52 | 114.67 | 114.90 |
| Camarilla | 114.26 | 114.29 | 114.33 | 114.36 | 114.40 | 114.43 | 114.47 |
| Woodie | 113.79 | 113.93 | 114.17 | 114.31 | 114.55 | 114.69 | 114.93 |
| Fibonacci | 113.91 | 114.06 | 114.15 | 114.29 | 114.44 | 114.53 | 114.67 |
| Pivot points | S3 | S2 | S1 | PP | R1 | R2 | R3 |
|---|---|---|---|---|---|---|---|
| Standard | 111.42 | 112.19 | 113.27 | 114.04 | 115.12 | 115.89 | 116.97 |
| Camarilla | 113.85 | 114.02 | 114.19 | 114.36 | 114.53 | 114.70 | 114.87 |
| Woodie | 111.59 | 112.27 | 113.44 | 114.12 | 115.29 | 115.97 | 117.14 |
| Fibonacci | 112.19 | 112.89 | 113.33 | 114.04 | 114.74 | 115.18 | 115.89 |
| Pivot points | S3 | S2 | S1 | PP | R1 | R2 | R3 |
|---|---|---|---|---|---|---|---|
| Standard | 104.68 | 107.77 | 111.14 | 114.23 | 117.60 | 120.69 | 124.06 |
| Camarilla | 112.72 | 113.32 | 113.91 | 114.50 | 115.09 | 115.68 | 116.28 |
| Woodie | 104.81 | 107.84 | 111.27 | 114.30 | 117.73 | 120.76 | 124.19 |
| Fibonacci | 107.77 | 110.24 | 111.77 | 114.23 | 116.70 | 118.23 | 120.69 |
Numerical data
The following is the status of technical indicators and moving averages registered at the time this technical analysis was created:
| RSI (14): | 66.77 | |
| MACD (12,26,9): | 0.1000 | |
| Directional Movement: | 11.54 | |
| AROON (14): | 50.00 | |
| DEMA (21): | 114.65 | |
| Parabolic SAR (0,02-0,02-0,2): | 114.35 | |
| Elder Ray (13): | 0.10 | |
| Super Trend (3,10): | 114.32 | |
| Zig ZAG (10): | 114.71 | |
| VORTEX (21): | 1.1500 | |
| Stochastique (14,3,5): | 73.85 | |
| TEMA (21): | 114.67 | |
| Williams %R (14): | -20.00 | |
| Chande Momentum Oscillator (20): | 0.30 | |
| Repulse (5,40,3): | 0.1300 | |
| ROCnROLL: | 1 | |
| TRIX (15,9): | 0.0100 | |
| Courbe Coppock: | 0.29 |
| MA7: | 114.22 | |
| MA20: | 113.72 | |
| MA50: | 112.37 | |
| MA100: | 111.14 | |
| MAexp7: | 114.64 | |
| MAexp20: | 114.52 | |
| MAexp50: | 114.37 | |
| MAexp100: | 114.22 | |
| Price / MA7: | +0.45% | |
| Price / MA20: | +0.89% | |
| Price / MA50: | +2.10% | |
| Price / MA100: | +3.23% | |
| Price / MAexp7: | +0.08% | |
| Price / MAexp20: | +0.18% | |
| Price / MAexp50: | +0.31% | |
| Price / MAexp100: | +0.45% |
News
The last news published on CAD/JPY at the time of the generation of this analysis was as follows:
-
 CAD/JPY Forecast March 7, 2023
-
CAD/JPY Forecast October 4, 2022
-
CAD/JPY Forecast September 19, 2022
-
USDJPY and CADJPY Push Reversal Risk as S&P 500 Mocks Technical Levels
-
S&P 500 Breaks Resistance and Immediately Stalls as CADJPY Explodes Higher
About author

Online


Add a comment
Comments
0 comments on the analysis CAD/JPY - 1H