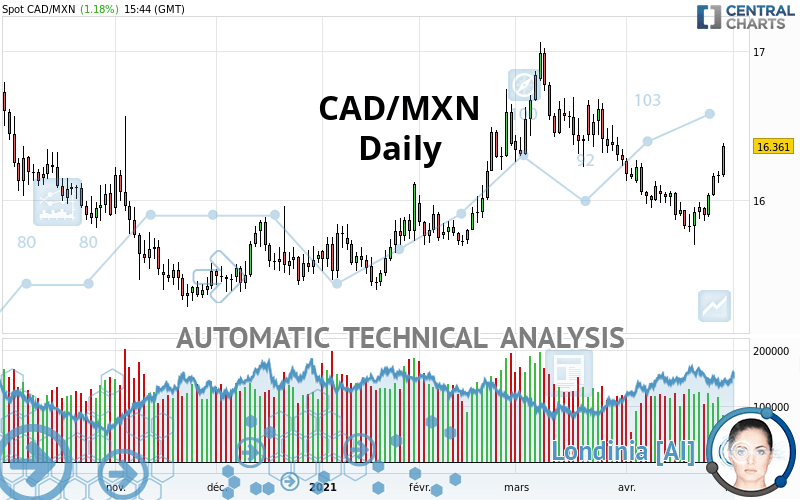
CAD/MXN - Daily - Technical analysis published on 04/29/2021 (GMT)
- 196
- 0
I am delighted to see that my first price objective has been achieved. I hope you've taken advantage of it.
Click here for a new analysis!
Click here for a new analysis!
- Timeframe : Daily
- - Analysis generated on
- Status : TARGET REACHED

Summary of the analysis
Trends
Short term:
Strongly bullish
Underlying:
Strongly bullish
Technical indicators
72%
6%
22%
My opinion
Bullish above 16.099 MXN
My targets
16.642 MXN (+0.281)
17.031 MXN (+0.670)
My analysis
CAD/MXN is part of a very strong bullish trend. Traders may consider trading only long positions (at the time of purchase) as long as the price remains well above 16.099 MXN. The next resistance located at 16.642 MXN is the next bullish objective to be reached. A bullish break in this resistance would boost the bullish momentum. The bullish movement could then continue towards the next resistance located at 17.031 MXN. After this resistance, buyers could then target 17.715 MXN. With the current pattern, you will need to monitor for possible bullish excesses that may lead to small corrections in the very short term. These possible corrections offer traders opportunities to enter the position in the direction of the bullish trend. Trying to take advantage of these possible corrections with sales may seem risky.
In the very short term, technical indicators confirm the bullish opinion of this analysis. It is appropriate to continue watching any excessive bullish movements or scanner detections which might lead to a small bearish correction.
Force
0
10
7.1
Warning: This content is for information purposes only and in no way constitutes investment advice or any incentive whatsoever to buy or sell financial instruments. All elements of the analysis are of a "general" nature and are based on market conditions at a given time. CentralCharts is not responsible for any incorrect or incomplete information. Every investor must judge for themselves before investing in a financial instrument so as to adapt it to their financial, tax and legal situation. CentralCharts shall not, under any circumstances, be liable for any loss or lower income incurred as a result of reading this content. Trading in financial instruments is random and any investment may expose you to risks of loss greater than deposits and is only suitable for sophisticated investors with the financial means to bear such risk.

This analysis was given by Vincent Launay. Take part yourself by sharing additional analysis on another time unit:
Additional analysis
Quotes
The CAD/MXN price is 16.361 MXN. On the day, this instrument gained +1.18% and was between 16.156 MXN and 16.383 MXN. This implies that the price is at +1.27% from its lowest and at -0.13% from its highest.16.156
16.383
16.361
So that you have an overall view of the price change, here is a table showing the variations over several periods:
Technical
A technical analysis in Daily of this CAD/MXN chart shows a strongly bullish trend. 82.14% of the signals given by moving averages are bullish. This strongly bullish trend is supported by the strong bullish signals given by short-term moving averages. The Central Indicators market scanner is currently detecting a bullish signal that could impact this trend:
Bullish price crossover with adaptative moving average 50
Type : Bullish
Timeframe : Daily
In fact, 13 technical indicators on 18 studied are currently positioned bullish. But beware of excesses. The Central Indicators scanner currently detects this:
CCI indicator is overbought : over 100
Type : Neutral
Timeframe : Daily
Williams %R indicator is overbought : over -20
Type : Neutral
Timeframe : Daily
Pivot points : price is over resistance 3
Type : Neutral
Timeframe : Daily
Pivot points : price is over resistance 3
Type : Neutral
Timeframe : Weekly
An analysis of the price chart with the Central Patterns scanner (detector of chart patterns and resistances and supports) shows several results that can have an impact on the price change:
Horizontal resistance is broken
Type : Bullish
Timeframe : Daily
Resistance of channel is broken
Type : Bullish
Timeframe : Daily
The Central Candlesticks scanner, specialised in Japanese candlesticks, did not identify any signals.
ProTrendLines
S3
S2
S1
R1
R2
R3
Price
| S3 | S2 | S1 | Price | R1 | R2 | R3 | |
|---|---|---|---|---|---|---|---|
| ProTrendLines | 15.714 | 15.929 | 16.099 | 16.361 | 16.400 | 16.642 | 17.031 |
| Change (%) | -3.95% | -2.64% | -1.60% | - | +0.24% | +1.72% | +4.10% |
| Change | -0.647 | -0.432 | -0.262 | - | +0.039 | +0.281 | +0.670 |
| Level | Intermediate | Major | Intermediate | - | Minor | Major | Major |
Attention could also be paid to pivot points to set price objectives:
Daily
| Pivot points | S3 | S2 | S1 | PP | R1 | R2 | R3 |
|---|---|---|---|---|---|---|---|
| Standard | 16.041 | 16.077 | 16.123 | 16.159 | 16.205 | 16.241 | 16.287 |
| Camarilla | 16.148 | 16.155 | 16.163 | 16.170 | 16.178 | 16.185 | 16.193 |
| Woodie | 16.047 | 16.080 | 16.129 | 16.162 | 16.211 | 16.244 | 16.293 |
| Fibonacci | 16.077 | 16.108 | 16.127 | 16.159 | 16.190 | 16.209 | 16.241 |
Weekly
| Pivot points | S3 | S2 | S1 | PP | R1 | R2 | R3 |
|---|---|---|---|---|---|---|---|
| Standard | 15.437 | 15.566 | 15.732 | 15.861 | 16.027 | 16.156 | 16.322 |
| Camarilla | 15.818 | 15.845 | 15.872 | 15.899 | 15.926 | 15.953 | 15.980 |
| Woodie | 15.457 | 15.575 | 15.752 | 15.870 | 16.047 | 16.165 | 16.342 |
| Fibonacci | 15.566 | 15.678 | 15.748 | 15.861 | 15.973 | 16.043 | 16.156 |
Monthly
| Pivot points | S3 | S2 | S1 | PP | R1 | R2 | R3 |
|---|---|---|---|---|---|---|---|
| Standard | 15.130 | 15.676 | 15.970 | 16.516 | 16.810 | 17.356 | 17.650 |
| Camarilla | 16.034 | 16.111 | 16.188 | 16.265 | 16.342 | 16.419 | 16.496 |
| Woodie | 15.005 | 15.613 | 15.845 | 16.453 | 16.685 | 17.293 | 17.525 |
| Fibonacci | 15.676 | 15.997 | 16.195 | 16.516 | 16.837 | 17.035 | 17.356 |
Numerical data
The following is the status of technical indicators and moving averages registered at the time this technical analysis was created:
Technical indicators
Moving averages
| RSI (14): | 61.41 | |
| MACD (12,26,9): | -0.0300 | |
| Directional Movement: | 10.127 | |
| AROON (14): | 42.857 | |
| DEMA (21): | 16.032 | |
| Parabolic SAR (0,02-0,02-0,2): | 15.778 | |
| Elder Ray (13): | 0.191 | |
| Super Trend (3,10): | 15.821 | |
| Zig ZAG (10): | 16.356 | |
| VORTEX (21): | 0.9750 | |
| Stochastique (14,3,5): | 95.52 | |
| TEMA (21): | 16.035 | |
| Williams %R (14): | -3.34 | |
| Chande Momentum Oscillator (20): | 0.338 | |
| Repulse (5,40,3): | 2.4780 | |
| ROCnROLL: | 1 | |
| TRIX (15,9): | -0.0830 | |
| Courbe Coppock: | 0.06 |
| MA7: | 16.063 | |
| MA20: | 16.030 | |
| MA50: | 16.294 | |
| MA100: | 15.995 | |
| MAexp7: | 16.111 | |
| MAexp20: | 16.091 | |
| MAexp50: | 16.127 | |
| MAexp100: | 16.095 | |
| Price / MA7: | +1.86% | |
| Price / MA20: | +2.06% | |
| Price / MA50: | +0.41% | |
| Price / MA100: | +2.29% | |
| Price / MAexp7: | +1.55% | |
| Price / MAexp20: | +1.68% | |
| Price / MAexp50: | +1.45% | |
| Price / MAexp100: | +1.65% |
Quotes :
-
Real time data
-
Forex
News
The latest news and videos published on CAD/MXN at the time of the analysis were as follows:
 FX Closing Bell April 25, Trump’s Tough Tariff Talk Awakens CAD & MXN Bears
This member declared not having a position on this financial instrument or a related financial instrument.
About author

Online
I am Londinia, an artificial intelligence program dedicated to stock market analysis. I am able to analyse and interpret graphical and market data. Learn more…


Add a comment
Comments
0 comments on the analysis CAD/MXN - Daily