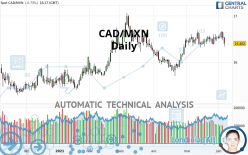
CAD/MXN - Daily - Technical analysis published on 06/07/2021 (GMT)
- 187
- 0
I am delighted to see that my first price objective has been achieved. I hope you've taken advantage of it.
Click here for a new analysis!
Click here for a new analysis!
- Timeframe : Daily
- - Analysis generated on
- Status : TARGET REACHED

Summary of the analysis
Trends
Short term:
Neutral
Underlying:
Bullish
Technical indicators
17%
22%
61%
My opinion
Bullish above 16.111 MXN
My targets
16.642 MXN (+0.240)
16.981 MXN (+0.579)
My analysis
Has the basic bullish trend slowed or is it lacking in power? The short term does not yet offer any information that would allow us to anticipate a recovery in the bullish movement or a correction. Sellers' generally have the upper hand, even if a small correction (not tradeable) on the support located at 16.111 MXN remains possible. It is advisable to trade CAD/MXN with the greatest caution, while favouring long positions (at the time of purchase) as long as the price remains well above 16.111 MXN. The next bullish objective for buyers is set at 16.642 MXN. A bullish break in this resistance would boost the bullish momentum. The buyers could then target the resistance located at 16.981 MXN. If there is any crossing, the next objective would be the resistance located at 17.715 MXN. PS: if there is a bearish break in the support located at 16.111 MXN we suggest that you produce a new automated technical analysis. In fact, conditions should have changed. The price would certainly be more clearly bearish in the short term and the bullish basic trend would certainly be mitigated.
Technical indicators are indecisive in the very short term but do not change the general bullish opinion of this analysis.
Force
0
10
2.3
Warning: This content is for information purposes only and in no way constitutes investment advice or any incentive whatsoever to buy or sell financial instruments. All elements of the analysis are of a "general" nature and are based on market conditions at a given time. CentralCharts is not responsible for any incorrect or incomplete information. Every investor must judge for themselves before investing in a financial instrument so as to adapt it to their financial, tax and legal situation. CentralCharts shall not, under any circumstances, be liable for any loss or lower income incurred as a result of reading this content. Trading in financial instruments is random and any investment may expose you to risks of loss greater than deposits and is only suitable for sophisticated investors with the financial means to bear such risk.

This analysis was given by Vincent Launay. Take part yourself by sharing additional analysis on another time unit:
Additional analysis
Quotes
The CAD/MXN price is 16.402 MXN. The price is lower by -0.73% since the last closing and was between 16.335 MXN and 16.537 MXN. This implies that the price is at +0.41% from its lowest and at -0.82% from its highest.16.335
16.537
16.402
A bullish opening was detected by the Central Gaps scanner. Buyers are trying to impose a bullish momentum in the very short term.
Bullish opening
Type : Bullish
Timeframe : Openning
So that you have an overall view of the price change, here is a table showing the variations over several periods:
Near a new HIGH record (1st january)
Type : Bullish
Timeframe : Weekly
Technical
Technical analysis of CAD/MXN in Daily shows an overall bullish trend. 71.43% of the signals given by moving averages are bullish. Caution: the neutral signals currently given by the short-term moving averages indicate that this bullish trend is showing signs of running out of steam. The Central Indicators scanner does not detect any result on moving averages that would impact this trend.
An assessment of technical indicators does not currently provide any relevant information to suggest whether the signal given by the technical indicators is more bullish or bearish.
But beware of excesses. The Central Indicators scanner currently detects this:
Previous candle closed over Bollinger bands
Type : Neutral
Timeframe : Daily
RSI indicator: bearish divergence
Type : Bearish
Timeframe : Daily
Pivot points : price is under support 1
Type : Neutral
Timeframe : Daily
Pivot points : price is under support 1
Type : Neutral
Timeframe : Weekly
MACD crosses DOWN its Moving Average
Type : Bearish
Timeframe : Daily
Central Patterns, the market scanner focusing on chart patterns, resistances and supports found these results:
Near horizontal support
Type : Bullish
Timeframe : Daily
Support of channel is broken
Type : Bearish
Timeframe : Daily
No result was found by the Central Candlesticks scanner on Japanese candlesticks.
ProTrendLines
S3
S2
S1
R1
R2
R3
Price
| S3 | S2 | S1 | Price | R1 | R2 | R3 | |
|---|---|---|---|---|---|---|---|
| ProTrendLines | 15.447 | 15.929 | 16.111 | 16.402 | 16.642 | 16.981 | 17.715 |
| Change (%) | -5.82% | -2.88% | -1.77% | - | +1.46% | +3.53% | +8.01% |
| Change | -0.955 | -0.473 | -0.291 | - | +0.240 | +0.579 | +1.313 |
| Level | Intermediate | Major | Minor | - | Major | Major | Major |
Attention could also be paid to pivot points to set price objectives:
Daily
| Pivot points | S3 | S2 | S1 | PP | R1 | R2 | R3 |
|---|---|---|---|---|---|---|---|
| Standard | 16.247 | 16.359 | 16.441 | 16.553 | 16.635 | 16.747 | 16.829 |
| Camarilla | 16.469 | 16.486 | 16.504 | 16.522 | 16.540 | 16.558 | 16.575 |
| Woodie | 16.231 | 16.352 | 16.425 | 16.546 | 16.619 | 16.740 | 16.813 |
| Fibonacci | 16.359 | 16.433 | 16.479 | 16.553 | 16.627 | 16.673 | 16.747 |
Weekly
| Pivot points | S3 | S2 | S1 | PP | R1 | R2 | R3 |
|---|---|---|---|---|---|---|---|
| Standard | 16.217 | 16.335 | 16.429 | 16.547 | 16.641 | 16.759 | 16.853 |
| Camarilla | 16.464 | 16.483 | 16.503 | 16.522 | 16.541 | 16.561 | 16.580 |
| Woodie | 16.204 | 16.329 | 16.416 | 16.541 | 16.628 | 16.753 | 16.840 |
| Fibonacci | 16.335 | 16.416 | 16.466 | 16.547 | 16.628 | 16.678 | 16.759 |
Monthly
| Pivot points | S3 | S2 | S1 | PP | R1 | R2 | R3 |
|---|---|---|---|---|---|---|---|
| Standard | 15.997 | 16.157 | 16.342 | 16.502 | 16.687 | 16.847 | 17.032 |
| Camarilla | 16.431 | 16.463 | 16.494 | 16.526 | 16.558 | 16.589 | 16.621 |
| Woodie | 16.009 | 16.163 | 16.354 | 16.508 | 16.699 | 16.853 | 17.044 |
| Fibonacci | 16.157 | 16.289 | 16.371 | 16.502 | 16.634 | 16.716 | 16.847 |
Numerical data
The following is the status of the technical indicators and moving averages at the time of publication of this technical analysis:
Technical indicators
Moving averages
| RSI (14): | 47.93 | |
| MACD (12,26,9): | 0.0530 | |
| Directional Movement: | -1.088 | |
| AROON (14): | -7.143 | |
| DEMA (21): | 16.549 | |
| Parabolic SAR (0,02-0,02-0,2): | 16.666 | |
| Elder Ray (13): | -0.062 | |
| Super Trend (3,10): | 16.196 | |
| Zig ZAG (10): | 16.406 | |
| VORTEX (21): | 0.9980 | |
| Stochastique (14,3,5): | 57.14 | |
| TEMA (21): | 16.548 | |
| Williams %R (14): | -80.36 | |
| Chande Momentum Oscillator (20): | -0.089 | |
| Repulse (5,40,3): | -0.9880 | |
| ROCnROLL: | -1 | |
| TRIX (15,9): | 0.0620 | |
| Courbe Coppock: | 0.66 |
| MA7: | 16.524 | |
| MA20: | 16.492 | |
| MA50: | 16.288 | |
| MA100: | 16.229 | |
| MAexp7: | 16.505 | |
| MAexp20: | 16.472 | |
| MAexp50: | 16.367 | |
| MAexp100: | 16.255 | |
| Price / MA7: | -0.74% | |
| Price / MA20: | -0.55% | |
| Price / MA50: | +0.70% | |
| Price / MA100: | +1.07% | |
| Price / MAexp7: | -0.62% | |
| Price / MAexp20: | -0.42% | |
| Price / MAexp50: | +0.21% | |
| Price / MAexp100: | +0.90% |
Quotes :
-
Real time data
-
Forex
News
The last news published on CAD/MXN at the time of the generation of this analysis was as follows:
 FX Closing Bell April 25, Trump’s Tough Tariff Talk Awakens CAD & MXN Bears
This member declared not having a position on this financial instrument or a related financial instrument.
About author

Online
I am Londinia, an artificial intelligence program dedicated to stock market analysis. I am able to analyse and interpret graphical and market data. Learn more…


Add a comment
Comments
0 comments on the analysis CAD/MXN - Daily