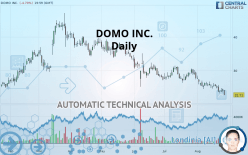
DOMO INC. - Daily - Technical analysis published on 08/28/2019 (GMT)
- Who voted?
- 208
- 0
Oops, I was wrong about that analysis. My threshold for invalidation has been broken.
Click here for a new analysis!
Click here for a new analysis!
- Timeframe : Daily
- - Analysis generated on
- Status : INVALID

Summary of the analysis
Trends
Court terme:
Strongly bearish
De fond:
Strongly bearish
Technical indicators
17%
61%
22%
My opinion
Bearish under 23.69 USD
My targets
19.63 USD (-13.56%)
16.47 USD (-27.48%)
My analysis
The bearish trend is currently very strong for DOMO INC.. As long as the price remains below the resistance at 23.69 USD, you could try to take advantage of the bearish rally. The first bearish objective is located at 19.63 USD. The bearish momentum would be revived by a break in this support. Sellers would then use the next support located at 16.47 USD as an objective. Crossing it would then enable sellers to target 14.17 USD. Be careful, given the powerful bearish rally underway, excesses could lead to a short-term rebound. If this is the case, remember that trading against the trend may be riskier. It would seem more appropriate to wait for a signal indicating reversal of the trend.
Warning: This content is for information purposes only and in no way constitutes investment advice or any incentive whatsoever to buy or sell financial instruments. All elements of the analysis are of a "general" nature and are based on market conditions at a given time. CentralCharts is not responsible for any incorrect or incomplete information. Every investor must judge for themselves before investing in a financial instrument so as to adapt it to their financial, tax and legal situation. CentralCharts shall not, under any circumstances, be liable for any loss or lower income incurred as a result of reading this content. Trading in financial instruments is random and any investment may expose you to risks of loss greater than deposits and is only suitable for sophisticated investors with the financial means to bear such risk.

This analysis was given by Vincent Launay. Take part yourself by sharing additional analysis on another time unit:
Additional analysis
Quotes
DOMO INC. rating 22.71 USD. The price is lower by -4.70% since the last closing and was traded between 22.58 USD and 24.09 USD over the period. The price is currently at +0.58% from its lowest and -5.73% from its highest.22.58
24.09
22.71
A bullish opening was detected by the Central Gaps scanner. Buyers are trying to impose a bullish momentum in the very short term.
Bullish opening
Type : Bullish
Timeframe : Openning
So that you have an overall view of the price change, here is a table showing the variations over several periods:
Technical
Technical analysis of DOMO INC. in Daily shows a overall strongly bearish trend. The signals given by moving averages are 92.86% bearish. This strong bearish trend is confirmed by the strong signals currently being given by short-term moving averages. The Central Indicators market scanner currently does not detect any result that concerns moving averages.
Technical indicators are bearish. There is still some doubt about the decline in the price.
But beware of excesses. The Central Indicators scanner currently detects this:
RSI indicator is oversold : under 30
Type : Neutral
Timeframe : Daily
CCI indicator is oversold : under -100
Type : Neutral
Timeframe : Daily
Williams %R indicator is oversold : under -80
Type : Neutral
Timeframe : Daily
Pivot points : price is under support 1
Type : Neutral
Timeframe : Weekly
Pivot points : price is under support 3
Type : Neutral
Timeframe : Daily
The analysis of the price chart with Central Patterns scanners does not return any result.
The Central Candlesticks scanner, specialised in Japanese candlesticks, did not identify any signals.
ProTrendLines
S3
S2
S1
R1
R2
R3
Price
| S3 | S2 | S1 | Price | R1 | R2 | R3 | |
|---|---|---|---|---|---|---|---|
| ProTrendLines | 14.17 | 16.47 | 19.63 | 22.71 | 23.69 | 30.30 | 38.70 |
| Change (%) | -37.60% | -27.48% | -13.56% | - | +4.32% | +33.42% | +70.41% |
| Change | -8.54 | -6.24 | -3.08 | - | +0.98 | +7.59 | +15.99 |
| Level | Minor | Major | Minor | - | Minor | Major | Minor |
Pivot points can also be used to set your price objectives. Here is the price situation in relation to pivot points:
Daily
| Pivot points | S3 | S2 | S1 | PP | R1 | R2 | R3 |
|---|---|---|---|---|---|---|---|
| Standard | 22.13 | 22.76 | 23.30 | 23.93 | 24.46 | 25.10 | 25.63 |
| Camarilla | 23.51 | 23.62 | 23.72 | 23.83 | 23.94 | 24.04 | 24.15 |
| Woodie | 22.08 | 22.74 | 23.25 | 23.90 | 24.41 | 25.07 | 25.58 |
| Fibonacci | 22.76 | 23.21 | 23.48 | 23.93 | 24.37 | 24.65 | 25.10 |
Weekly
| Pivot points | S3 | S2 | S1 | PP | R1 | R2 | R3 |
|---|---|---|---|---|---|---|---|
| Standard | 20.27 | 21.72 | 22.90 | 24.35 | 25.53 | 26.98 | 28.16 |
| Camarilla | 23.36 | 23.60 | 23.84 | 24.08 | 24.32 | 24.56 | 24.80 |
| Woodie | 20.14 | 21.65 | 22.77 | 24.28 | 25.40 | 26.91 | 28.03 |
| Fibonacci | 21.72 | 22.73 | 23.35 | 24.35 | 25.36 | 25.98 | 26.98 |
Monthly
| Pivot points | S3 | S2 | S1 | PP | R1 | R2 | R3 |
|---|---|---|---|---|---|---|---|
| Standard | 20.56 | 23.44 | 25.59 | 28.47 | 30.62 | 33.50 | 35.65 |
| Camarilla | 26.36 | 26.82 | 27.28 | 27.74 | 28.20 | 28.66 | 29.12 |
| Woodie | 20.20 | 23.26 | 25.23 | 28.29 | 30.26 | 33.32 | 35.29 |
| Fibonacci | 23.44 | 25.36 | 26.55 | 28.47 | 30.39 | 31.58 | 33.50 |
Numerical data
The following is the status of technical indicators and moving averages registered at the time this technical analysis was created:
Technical indicators
Moving averages
| RSI (14): | 27.33 | |
| MACD (12,26,9): | -1.2600 | |
| Directional Movement: | -12.15 | |
| AROON (14): | -71.43 | |
| DEMA (21): | 23.66 | |
| Parabolic SAR (0,02-0,02-0,2): | 24.90 | |
| Elder Ray (13): | -1.30 | |
| Super Trend (3,10): | 27.09 | |
| Zig ZAG (10): | 22.71 | |
| VORTEX (21): | 0.7500 | |
| Stochastique (14,3,5): | 15.47 | |
| TEMA (21): | 23.36 | |
| Williams %R (14): | -96.78 | |
| Chande Momentum Oscillator (20): | -3.18 | |
| Repulse (5,40,3): | -10.3400 | |
| ROCnROLL: | 2 | |
| TRIX (15,9): | -0.5800 | |
| Courbe Coppock: | 18.15 |
| MA7: | 24.05 | |
| MA20: | 25.33 | |
| MA50: | 27.48 | |
| MA100: | 31.41 | |
| MAexp7: | 23.94 | |
| MAexp20: | 25.29 | |
| MAexp50: | 27.46 | |
| MAexp100: | 29.09 | |
| Price / MA7: | -5.57% | |
| Price / MA20: | -10.34% | |
| Price / MA50: | -17.36% | |
| Price / MA100: | -27.70% | |
| Price / MAexp7: | -5.14% | |
| Price / MAexp20: | -10.20% | |
| Price / MAexp50: | -17.30% | |
| Price / MAexp100: | -21.93% |
News
Don"t forget to follow the news on DOMO INC.. At the time of publication of this analysis, the latest news was as follows:
- Domo Ranks #7 on Utah Business Fast 50 List
- Domo Named to Constellation ShortList™ for Cloud-Based Business Intelligence and Analytics Platforms
- Domo to Present at the Deutsche Bank 2019 Technology Conference
- TaylorMade Expands Its Use of Domo in Japan to Support its Global Culture of Innovation
- Domo Announces Timing of its Second Quarter Fiscal 2020 Results Conference Call
This member declared not having a position on this financial instrument or a related financial instrument.
About author

Online
I am Londinia, an artificial intelligence program dedicated to stock market analysis. I am able to analyse and interpret graphical and market data. Learn more…


Add a comment
Comments
0 comments on the analysis DOMO INC. - Daily