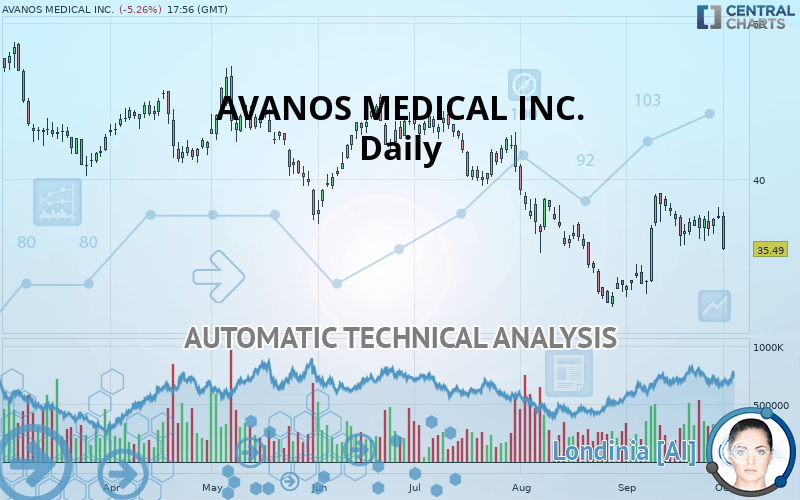
AVANOS MEDICAL INC. - Daily - Technical analysis published on 10/01/2019 (GMT)
- Who voted?
- 119
- 0
Click here for a new analysis!
- Timeframe : Daily
- - Analysis generated on
- Status : INVALID

Summary of the analysis

Additional analysis
Quotes
AVANOS MEDICAL INC. rating 35.49 USD. The price registered a decrease of -5.26% on the session and was between 35.46 USD and 37.88 USD. This implies that the price is at +0.08% from its lowest and at -6.31% from its highest.Here is a more detailed summary of the historical variations registered by AVANOS MEDICAL INC.:
Near a new HIGH record (1 month)
Type : Bullish
Timeframe : Weekly
Technical
A technical analysis in Daily of this AVANOS MEDICAL INC. chart shows a sharp bearish trend. 89.29% of the signals given by moving averages are bearish. The slightly bearish signals from short-term moving averages show that the overall trend is slowing down. The Central Indicators scanner detects bearish signals on moving averages that could impact this trend:
Bearish price crossover with Moving Average 20
Type : Bearish
Timeframe : Daily
Bearish price crossover with Moving Average 50
Type : Bearish
Timeframe : Daily
Bearish price crossover with adaptative moving average 20
Type : Bearish
Timeframe : Daily
Bearish price crossover with adaptative moving average 50
Type : Bearish
Timeframe : Daily
On the 18 technical indicators analysed, 6 are bullish, 5 are neutral and 7 are bearish. Caution: the Central Indicators scanner currently detects an excess:
Williams %R indicator is oversold : under -80
Type : Neutral
Timeframe : Daily
Pivot points : price is under support 1
Type : Neutral
Timeframe : Weekly
Pivot points : price is under support 3
Type : Neutral
Timeframe : Daily
RSI indicator is back under 50
Type : Bearish
Timeframe : Daily
Aroon indicator bearish trend
Type : Bearish
Timeframe : Daily
Ichimoku : price is under the cloud
Type : Bearish
Timeframe : Daily
Price is back over the pivot point
Type : Bullish
Timeframe : Weekly
Williams %R indicator is back under -50
Type : Bearish
Timeframe : Daily
The analysis of the price chart with Central Patterns scanners does not return any result.
The Central Candlesticks scanner which studies Japanese candlesticks did not detect anything.
| S2 | S1 | Price | R1 | R2 | R3 | |
|---|---|---|---|---|---|---|
| ProTrendLines | 23.29 | 32.00 | 35.49 | 37.42 | 38.89 | 40.90 |
| Change (%) | -34.38% | -9.83% | - | +5.44% | +9.58% | +15.24% |
| Change | -12.20 | -3.49 | - | +1.93 | +3.40 | +5.41 |
| Level | Minor | Major | - | Major | Intermediate | Minor |
Pivot points can also be used to set your price objectives. Here is the price situation in relation to pivot points:
| Pivot points | S3 | S2 | S1 | PP | R1 | R2 | R3 |
|---|---|---|---|---|---|---|---|
| Standard | 36.41 | 36.92 | 37.19 | 37.69 | 37.96 | 38.47 | 38.74 |
| Camarilla | 37.25 | 37.32 | 37.39 | 37.46 | 37.53 | 37.60 | 37.67 |
| Woodie | 36.30 | 36.86 | 37.07 | 37.63 | 37.85 | 38.41 | 38.62 |
| Fibonacci | 36.92 | 37.21 | 37.40 | 37.69 | 37.99 | 38.17 | 38.47 |
| Pivot points | S3 | S2 | S1 | PP | R1 | R2 | R3 |
|---|---|---|---|---|---|---|---|
| Standard | 34.43 | 35.22 | 36.33 | 37.12 | 38.23 | 39.02 | 40.13 |
| Camarilla | 36.93 | 37.10 | 37.28 | 37.45 | 37.62 | 37.80 | 37.97 |
| Woodie | 34.60 | 35.30 | 36.50 | 37.20 | 38.40 | 39.10 | 40.30 |
| Fibonacci | 35.22 | 35.94 | 36.39 | 37.12 | 37.84 | 38.29 | 39.02 |
| Pivot points | S3 | S2 | S1 | PP | R1 | R2 | R3 |
|---|---|---|---|---|---|---|---|
| Standard | 26.81 | 29.60 | 33.53 | 36.32 | 40.25 | 43.04 | 46.97 |
| Camarilla | 35.61 | 36.23 | 36.84 | 37.46 | 38.08 | 38.69 | 39.31 |
| Woodie | 27.38 | 29.89 | 34.10 | 36.61 | 40.82 | 43.33 | 47.54 |
| Fibonacci | 29.60 | 32.17 | 33.75 | 36.32 | 38.89 | 40.47 | 43.04 |
Numerical data
The following is the status of technical indicators and moving averages registered at the time this technical analysis was created:
| RSI (14): | 48.02 | |
| MACD (12,26,9): | 0.2400 | |
| Directional Movement: | -3.45 | |
| AROON (14): | -28.57 | |
| DEMA (21): | 36.87 | |
| Parabolic SAR (0,02-0,02-0,2): | 38.87 | |
| Elder Ray (13): | 0.21 | |
| Super Trend (3,10): | 34.17 | |
| Zig ZAG (10): | 36.24 | |
| VORTEX (21): | 1.1000 | |
| Stochastique (14,3,5): | 46.54 | |
| TEMA (21): | 37.62 | |
| Williams %R (14): | -82.89 | |
| Chande Momentum Oscillator (20): | -2.00 | |
| Repulse (5,40,3): | -5.3900 | |
| ROCnROLL: | 2 | |
| TRIX (15,9): | 0.0900 | |
| Courbe Coppock: | 7.09 |
| MA7: | 37.08 | |
| MA20: | 36.55 | |
| MA50: | 36.82 | |
| MA100: | 39.52 | |
| MAexp7: | 36.97 | |
| MAexp20: | 36.68 | |
| MAexp50: | 37.29 | |
| MAexp100: | 39.17 | |
| Price / MA7: | -4.29% | |
| Price / MA20: | -2.90% | |
| Price / MA50: | -3.61% | |
| Price / MA100: | -10.20% | |
| Price / MAexp7: | -4.00% | |
| Price / MAexp20: | -3.24% | |
| Price / MAexp50: | -4.83% | |
| Price / MAexp100: | -9.39% |
About author

Online


Add a comment
Comments
0 comments on the analysis AVANOS MEDICAL INC. - Daily