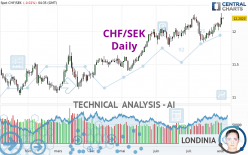
CHF/SEK - Daily - Technical analysis published on 08/03/2023 (GMT)
- 131
- 0
Click here for a new analysis!
- Timeframe : Daily
- - Analysis generated on
- Status : TARGET REACHED

Summary of the analysis

Additional analysis
Quotes
CHF/SEK rating 12.2031 SEK. The price is lower by -0.01% since the last closing and was between 12.1868 SEK and 12.2176 SEK. This implies that the price is at +0.13% from its lowest and at -0.12% from its highest.A bearish opening was detected by the Central Gaps scanner. Sellers are trying to impose a bearish trend in the very short term.
Bearish opening
Type : Bearish
Timeframe : Openning
Here is a more detailed summary of the historical variations registered by CHF/SEK:
New HIGH record (5 years)
Type : Bullish
Timeframe : Weekly
Near a new HIGH record (1 year)
Type : Bullish
Timeframe : Weekly
Near a new HIGH record (1st january)
Type : Bullish
Timeframe : Weekly
Near a new LOW record (1 month)
Type : Bearish
Timeframe : Weekly
Technical
A technical analysis in Daily of this CHF/SEK chart shows a strongly bullish trend. 89.29% of the signals given by moving averages are bullish. The slightly bullish signals given by the short-term moving averages show a weakening of the global trend. The Central Indicators scanner does not detect any result on moving averages that would impact this trend.
In fact, according to the parameters integrated into the Central Analyzer system, 16 technical indicators out of 18 analysed are currently bullish. Caution: the Central Indicators scanner currently detects an excess:
CCI indicator is overbought : over 100
Type : Neutral
Timeframe : Daily
Williams %R indicator is overbought : over -20
Type : Neutral
Timeframe : Daily
Pivot points : price is over resistance 1
Type : Neutral
Timeframe : Weekly
An analysis of the price chart with the Central Patterns scanner (detector of chart patterns and resistances and supports) shows several results that can have an impact on the price change:
Near horizontal resistance
Type : Bearish
Timeframe : Daily
Resistance of channel is broken
Type : Bullish
Timeframe : Daily
Central Candlesticks, the scanner specialised in Japanese candlesticks, detects these bearish signals that could support the hypothesis of a small drop in the very short term:
Bearish harami
Type : Bearish
Timeframe : Daily
Bearish harami cross
Type : Bearish
Timeframe : Daily
| S3 | S2 | S1 | Price | R1 | |
|---|---|---|---|---|---|
| ProTrendLines | 11.4152 | 11.6241 | 11.8732 | 12.2031 | 12.2115 |
| Change (%) | -6.46% | -4.74% | -2.70% | - | +0.07% |
| Change | -0.7879 | -0.5790 | -0.3299 | - | +0.0084 |
| Level | Minor | Major | Intermediate | - | Major |
Attention could also be paid to pivot points to set price objectives:
| Pivot points | S3 | S2 | S1 | PP | R1 | R2 | R3 |
|---|---|---|---|---|---|---|---|
| Standard | 11.9192 | 12.0070 | 12.1053 | 12.1931 | 12.2914 | 12.3792 | 12.4775 |
| Camarilla | 12.1525 | 12.1696 | 12.1866 | 12.2037 | 12.2208 | 12.2378 | 12.2549 |
| Woodie | 11.9246 | 12.0096 | 12.1107 | 12.1957 | 12.2968 | 12.3818 | 12.4829 |
| Fibonacci | 12.0070 | 12.0781 | 12.1220 | 12.1931 | 12.2642 | 12.3081 | 12.3792 |
| Pivot points | S3 | S2 | S1 | PP | R1 | R2 | R3 |
|---|---|---|---|---|---|---|---|
| Standard | 11.7692 | 11.8463 | 11.9854 | 12.0625 | 12.2016 | 12.2787 | 12.4178 |
| Camarilla | 12.0650 | 12.0848 | 12.1046 | 12.1244 | 12.1442 | 12.1640 | 12.1839 |
| Woodie | 11.8001 | 11.8618 | 12.0163 | 12.0780 | 12.2325 | 12.2942 | 12.4487 |
| Fibonacci | 11.8463 | 11.9289 | 11.9799 | 12.0625 | 12.1451 | 12.1961 | 12.2787 |
| Pivot points | S3 | S2 | S1 | PP | R1 | R2 | R3 |
|---|---|---|---|---|---|---|---|
| Standard | 11.4302 | 11.6335 | 11.8532 | 12.0565 | 12.2762 | 12.4795 | 12.6992 |
| Camarilla | 11.9567 | 11.9955 | 12.0342 | 12.0730 | 12.1118 | 12.1506 | 12.1893 |
| Woodie | 11.4385 | 11.6376 | 11.8615 | 12.0606 | 12.2845 | 12.4836 | 12.7075 |
| Fibonacci | 11.6335 | 11.7951 | 11.8949 | 12.0565 | 12.2181 | 12.3179 | 12.4795 |
Numerical data
The following is the status of technical indicators and moving averages registered at the time this technical analysis was created:
| RSI (14): | 64.22 | |
| MACD (12,26,9): | 0.0478 | |
| Directional Movement: | 10.0541 | |
| AROON (14): | 85.7142 | |
| DEMA (21): | 12.1194 | |
| Parabolic SAR (0,02-0,02-0,2): | 11.9498 | |
| Elder Ray (13): | 0.1142 | |
| Super Trend (3,10): | 12.2198 | |
| Zig ZAG (10): | 12.2094 | |
| VORTEX (21): | 1.0539 | |
| Stochastique (14,3,5): | 79.63 | |
| TEMA (21): | 12.1277 | |
| Williams %R (14): | -16.39 | |
| Chande Momentum Oscillator (20): | 0.3077 | |
| Repulse (5,40,3): | 0.6347 | |
| ROCnROLL: | 1 | |
| TRIX (15,9): | 0.0290 | |
| Courbe Coppock: | 2.16 |
| MA7: | 12.1279 | |
| MA20: | 12.0383 | |
| MA50: | 12.0068 | |
| MA100: | 11.7559 | |
| MAexp7: | 12.1303 | |
| MAexp20: | 12.0628 | |
| MAexp50: | 11.9661 | |
| MAexp100: | 11.8028 | |
| Price / MA7: | +0.62% | |
| Price / MA20: | +1.37% | |
| Price / MA50: | +1.63% | |
| Price / MA100: | +3.80% | |
| Price / MAexp7: | +0.59% | |
| Price / MAexp20: | +1.16% | |
| Price / MAexp50: | +1.97% | |
| Price / MAexp100: | +3.38% |
About author
Online


Add a comment
Comments
0 comments on the analysis CHF/SEK - Daily