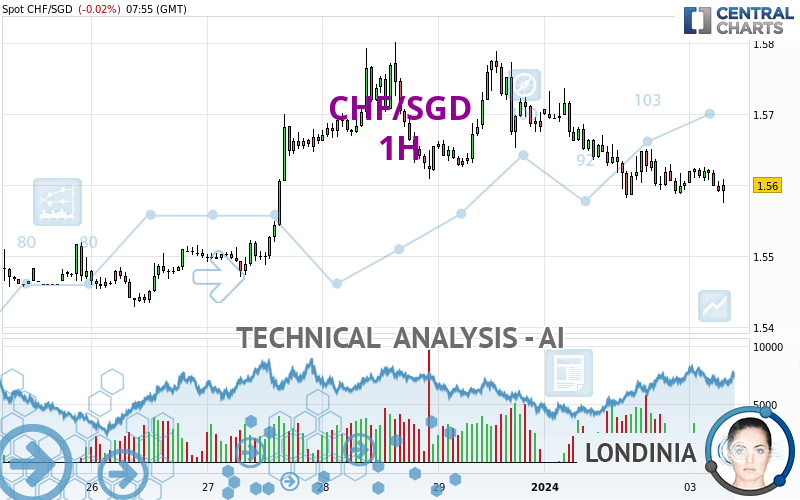
CHF/SGD - 1H - Technical analysis published on 01/03/2024 (GMT)
- 106
- 0
Click here for a new analysis!
- Timeframe : 1H
- - Analysis generated on
- Status : LEVEL MAINTAINED
Summary of the analysis

Additional analysis
Quotes
The CHF/SGD price is 1.5600 SGD. On the day, this instrument lost -0.02% with the lowest point at 1.5575 SGD and the highest point at 1.5625 SGD. The deviation from the price is +0.16% for the low point and -0.16% for the high point.A study of price movements over other periods shows the following variations:
Near a new HIGH record (5 years)
Type : Bullish
Timeframe : Weekly
Near a new HIGH record (1 year)
Type : Bullish
Timeframe : Weekly
Near a new HIGH record (1st january)
Type : Bullish
Timeframe : Weekly
New LOW record (1st january)
Type : Bearish
Timeframe : Weekly
Near a new LOW record (1 month)
Type : Bearish
Timeframe : Weekly
Technical
A technical analysis in 1H of this CHF/SGD chart shows a bearish trend. The signals given by moving averages are at 71.43% bearish. This bearish trend shows slight signs of slowing down given the slightly bearish signals of short-term moving averages. The Central Indicators market scanner currently does not detect any result that concerns moving averages.
In fact, only 9 technical indicators out of 18 studied are currently positioned bearish. But beware of excesses. The Central Indicators scanner currently detects this:
CCI indicator is oversold : under -100
Type : Neutral
Timeframe : 1 hour
Price is back under the pivot point
Type : Bearish
Timeframe : Weekly
Williams %R indicator is back over -50
Type : Bullish
Timeframe : 1 hour
The Central Patterns scanner, which studies chart patterns, resistances and supports, has identified these signals:
Near horizontal support
Type : Bullish
Timeframe : 1 hour
Support of channel is broken
Type : Bearish
Timeframe : 1 hour
There is also a Japanese candlestick pattern detected by Central Candlesticks that could mark the end of the current short-term trend:
Doji
Type : Neutral
Timeframe : 1 hour
| S3 | S2 | S1 | Price | R1 | R2 | R3 | |
|---|---|---|---|---|---|---|---|
| ProTrendLines | 1.5434 | 1.5470 | 1.5518 | 1.5600 | 1.5608 | 1.5651 | 1.5700 |
| Change (%) | -1.06% | -0.83% | -0.53% | - | +0.05% | +0.33% | +0.64% |
| Change | -0.0166 | -0.0130 | -0.0082 | - | +0.0008 | +0.0051 | +0.0100 |
| Level | Minor | Minor | Major | - | Intermediate | Intermediate | Minor |
To determine price objectives, it is also possible to use the pivot points. Here is the price position in relation to pivot points:
| Pivot points | S3 | S2 | S1 | PP | R1 | R2 | R3 |
|---|---|---|---|---|---|---|---|
| Standard | 1.5459 | 1.5520 | 1.5562 | 1.5623 | 1.5665 | 1.5726 | 1.5768 |
| Camarilla | 1.5575 | 1.5584 | 1.5594 | 1.5603 | 1.5612 | 1.5622 | 1.5631 |
| Woodie | 1.5449 | 1.5515 | 1.5552 | 1.5618 | 1.5655 | 1.5721 | 1.5758 |
| Fibonacci | 1.5520 | 1.5560 | 1.5584 | 1.5623 | 1.5663 | 1.5687 | 1.5726 |
| Pivot points | S3 | S2 | S1 | PP | R1 | R2 | R3 |
|---|---|---|---|---|---|---|---|
| Standard | 1.5100 | 1.5264 | 1.5473 | 1.5637 | 1.5846 | 1.6010 | 1.6219 |
| Camarilla | 1.5579 | 1.5614 | 1.5648 | 1.5682 | 1.5716 | 1.5750 | 1.5785 |
| Woodie | 1.5123 | 1.5275 | 1.5496 | 1.5648 | 1.5869 | 1.6021 | 1.6242 |
| Fibonacci | 1.5264 | 1.5407 | 1.5495 | 1.5637 | 1.5780 | 1.5868 | 1.6010 |
| Pivot points | S3 | S2 | S1 | PP | R1 | R2 | R3 |
|---|---|---|---|---|---|---|---|
| Standard | 1.4753 | 1.4987 | 1.5334 | 1.5568 | 1.5915 | 1.6149 | 1.6496 |
| Camarilla | 1.5522 | 1.5576 | 1.5629 | 1.5682 | 1.5735 | 1.5789 | 1.5842 |
| Woodie | 1.4811 | 1.5015 | 1.5392 | 1.5596 | 1.5973 | 1.6177 | 1.6554 |
| Fibonacci | 1.4987 | 1.5209 | 1.5346 | 1.5568 | 1.5790 | 1.5927 | 1.6149 |
Numerical data
The following is the status of technical indicators and moving averages registered at the time this technical analysis was created:
| RSI (14): | 41.06 | |
| MACD (12,26,9): | -0.0013 | |
| Directional Movement: | -9.9249 | |
| AROON (14): | -100.0000 | |
| DEMA (21): | 1.5595 | |
| Parabolic SAR (0,02-0,02-0,2): | 1.5627 | |
| Elder Ray (13): | -0.0016 | |
| Super Trend (3,10): | 1.5662 | |
| Zig ZAG (10): | 1.5589 | |
| VORTEX (21): | 0.9646 | |
| Stochastique (14,3,5): | 18.23 | |
| TEMA (21): | 1.5595 | |
| Williams %R (14): | -72.22 | |
| Chande Momentum Oscillator (20): | -0.0026 | |
| Repulse (5,40,3): | -0.1084 | |
| ROCnROLL: | 2 | |
| TRIX (15,9): | -0.0131 | |
| Courbe Coppock: | 0.15 |
| MA7: | 1.5625 | |
| MA20: | 1.5451 | |
| MA50: | 1.5279 | |
| MA100: | 1.5244 | |
| MAexp7: | 1.5603 | |
| MAexp20: | 1.5613 | |
| MAexp50: | 1.5632 | |
| MAexp100: | 1.5622 | |
| Price / MA7: | -0.16% | |
| Price / MA20: | +0.96% | |
| Price / MA50: | +2.10% | |
| Price / MA100: | +2.34% | |
| Price / MAexp7: | -0.02% | |
| Price / MAexp20: | -0.08% | |
| Price / MAexp50: | -0.20% | |
| Price / MAexp100: | -0.14% |
About author
Online


Add a comment
Comments
0 comments on the analysis CHF/SGD - 1H