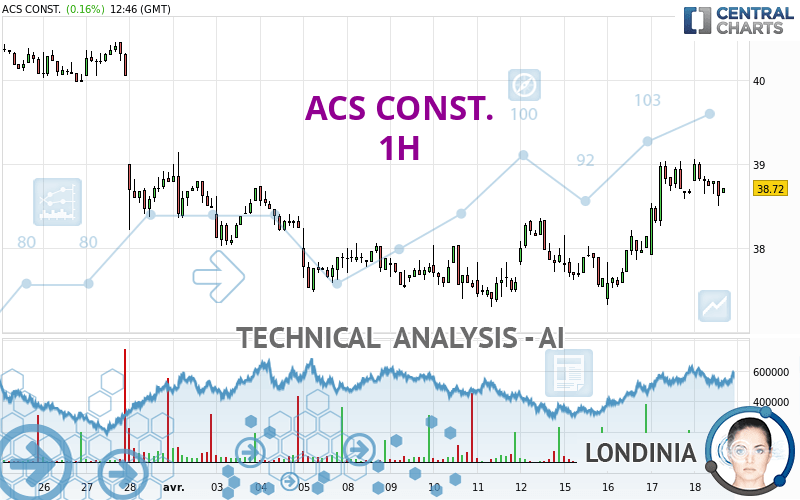
ACS CONST. - 1H - Technical analysis published on 04/18/2024 (GMT)
- 57
- 0
Click here for a new analysis!
- Timeframe : 1H
- - Analysis generated on
- Status : INVALID

Summary of the analysis

Additional analysis
Quotes
The ACS CONST. price is 38.62 EUR. On the day, this instrument lost -0.10% and was between 38.50 EUR and 39.06 EUR. This implies that the price is at +0.31% from its lowest and at -1.13% from its highest.A bullish opening was detected by the Central Gaps scanner. Buyers are trying to impose a bullish momentum in the very short term.
Bullish opening
Type : Bullish
Timeframe : Openning
Here is a more detailed summary of the historical variations registered by ACS CONST.:
Near a new HIGH record (5 years)
Type : Bullish
Timeframe : Weekly
Near a new HIGH record (1 year)
Type : Bullish
Timeframe : Weekly
Near a new HIGH record (1st january)
Type : Bullish
Timeframe : Weekly
Near a new HIGH record (1 month)
Type : Bullish
Timeframe : Weekly
Technical
Technical analysis of ACS CONST. in 1H shows a strongly overall bullish trend. 89.29% of the signals given by moving averages are bullish. The overall trend is supported by the strong bullish signals from short-term moving averages. The Central Indicators market scanner currently does not detect any result that concerns moving averages.
An assessment of technical indicators does not currently provide any relevant information on the direction of future price movements.
Other results related to technical indicators were also found by the Central Indicators scanner:
Pivot points : price is over resistance 1
Type : Neutral
Timeframe : Weekly
MACD crosses DOWN its Moving Average
Type : Bearish
Timeframe : 1 hour
Parabolic SAR indicator bearish reversal
Type : Bearish
Timeframe : 1 hour
Momentum indicator is back under 0
Type : Bearish
Timeframe : 1 hour
Central Patterns, the market scanner focusing on chart patterns, resistances and supports found these results:
Near resistance of channel
Type : Bearish
Timeframe : 1 hour
Horizontal resistance is broken
Type : Bullish
Timeframe : 1 hour
No result was found by the Central Candlesticks scanner on Japanese candlesticks.
| S3 | S2 | S1 | Price | R1 | R2 | R3 | |
|---|---|---|---|---|---|---|---|
| ProTrendLines | 37.54 | 38.04 | 38.36 | 38.62 | 38.74 | 39.45 | 39.88 |
| Change (%) | -2.80% | -1.50% | -0.67% | - | +0.31% | +2.15% | +3.26% |
| Change | -1.08 | -0.58 | -0.26 | - | +0.12 | +0.83 | +1.26 |
| Level | Intermediate | Intermediate | Minor | - | Minor | Minor | Major |
Pivot points can also be used to set your price objectives. Here is the price situation in relation to pivot points:
| Pivot points | S3 | S2 | S1 | PP | R1 | R2 | R3 |
|---|---|---|---|---|---|---|---|
| Standard | 36.92 | 37.42 | 38.04 | 38.54 | 39.16 | 39.66 | 40.28 |
| Camarilla | 38.35 | 38.46 | 38.56 | 38.66 | 38.76 | 38.87 | 38.97 |
| Woodie | 36.98 | 37.45 | 38.10 | 38.57 | 39.22 | 39.69 | 40.34 |
| Fibonacci | 37.42 | 37.85 | 38.11 | 38.54 | 38.97 | 39.23 | 39.66 |
| Pivot points | S3 | S2 | S1 | PP | R1 | R2 | R3 |
|---|---|---|---|---|---|---|---|
| Standard | 36.30 | 36.80 | 37.36 | 37.86 | 38.42 | 38.92 | 39.48 |
| Camarilla | 37.63 | 37.73 | 37.82 | 37.92 | 38.02 | 38.11 | 38.21 |
| Woodie | 36.33 | 36.82 | 37.39 | 37.88 | 38.45 | 38.94 | 39.51 |
| Fibonacci | 36.80 | 37.21 | 37.46 | 37.86 | 38.27 | 38.52 | 38.92 |
| Pivot points | S3 | S2 | S1 | PP | R1 | R2 | R3 |
|---|---|---|---|---|---|---|---|
| Standard | 30.37 | 32.83 | 35.81 | 38.27 | 41.25 | 43.71 | 46.69 |
| Camarilla | 37.28 | 37.78 | 38.28 | 38.78 | 39.28 | 39.78 | 40.28 |
| Woodie | 30.62 | 32.96 | 36.06 | 38.40 | 41.50 | 43.84 | 46.94 |
| Fibonacci | 32.83 | 34.91 | 36.20 | 38.27 | 40.35 | 41.64 | 43.71 |
Numerical data
The following are the details of the technical indicators and moving averages that were collected to generate this technical analysis:
| RSI (14): | 54.99 | |
| MACD (12,26,9): | 0.2200 | |
| Directional Movement: | 11.17 | |
| AROON (14): | 64.29 | |
| DEMA (21): | 38.85 | |
| Parabolic SAR (0,02-0,02-0,2): | 39.06 | |
| Elder Ray (13): | -0.02 | |
| Super Trend (3,10): | 38.14 | |
| Zig ZAG (10): | 38.66 | |
| VORTEX (21): | 1.1400 | |
| Stochastique (14,3,5): | 67.21 | |
| TEMA (21): | 38.94 | |
| Williams %R (14): | -47.50 | |
| Chande Momentum Oscillator (20): | -0.30 | |
| Repulse (5,40,3): | 0.0000 | |
| ROCnROLL: | -1 | |
| TRIX (15,9): | 0.0900 | |
| Courbe Coppock: | 2.79 |
| MA7: | 38.03 | |
| MA20: | 38.77 | |
| MA50: | 38.14 | |
| MA100: | 38.17 | |
| MAexp7: | 38.75 | |
| MAexp20: | 38.56 | |
| MAexp50: | 38.27 | |
| MAexp100: | 38.28 | |
| Price / MA7: | +1.55% | |
| Price / MA20: | -0.39% | |
| Price / MA50: | +1.26% | |
| Price / MA100: | +1.18% | |
| Price / MAexp7: | -0.34% | |
| Price / MAexp20: | +0.16% | |
| Price / MAexp50: | +0.91% | |
| Price / MAexp100: | +0.89% |
About author
Online


Add a comment
Comments
0 comments on the analysis ACS CONST. - 1H