EUR/AUD - 1H - Technical analysis published on 04/16/2024 (GMT)
- 56
- 0
Click here for a new analysis!
- Timeframe : 1H
- - Analysis generated on
- Status : LEVEL MAINTAINED
Summary of the analysis

Additional analysis
Quotes
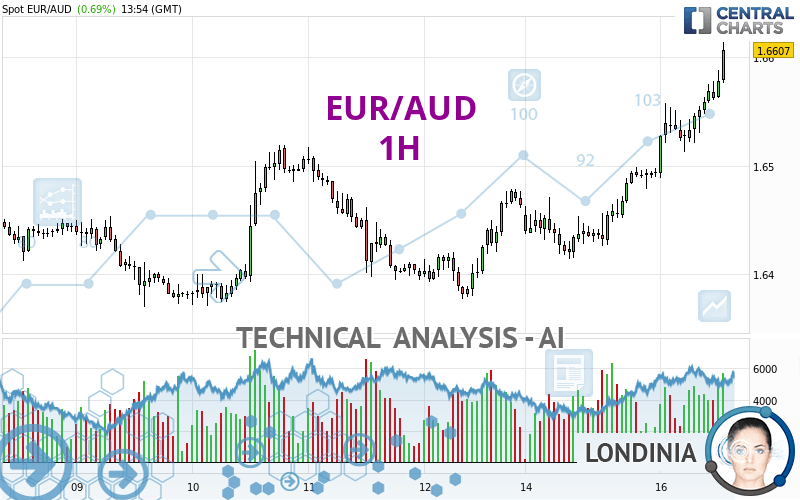
The EUR/AUD price is 1.6607 AUD. The price has increased by +0.69% since the last closing and was traded between 1.6489 AUD and 1.6614 AUD over the period. The price is currently at +0.72% from its lowest and -0.04% from its highest.The Central Gaps scanner detects a bearish opening. A small advantage for sellers in the very short term.
Bearish opening
Type : Bearish
Timeframe : Openning
Here is a more detailed summary of the historical variations registered by EUR/AUD:
Near a new LOW record (1 year)
Type : Bearish
Timeframe : Weekly
Near a new LOW record (1st january)
Type : Bearish
Timeframe : Weekly
Near a new HIGH record (1 month)
Type : Bullish
Timeframe : Weekly
Technical
Technical analysis of this 1H chart of EUR/AUD indicates that the overall trend is strongly bullish. 92.86% of the signals given by moving averages are bullish. The overall trend is supported by the strong bullish signals from short-term moving averages. The Central Indicators market scanner currently does not detect any result that concerns moving averages.
Technical indicators are strongly bullish, suggesting that the price increase should continue.
But beware of excesses. The Central Indicators scanner currently detects this:
RSI indicator is overbought : over 80
Type : Neutral
Timeframe : 1 hour
CCI indicator is overbought : over 100
Type : Neutral
Timeframe : 1 hour
Williams %R indicator is overbought : over -20
Type : Neutral
Timeframe : 1 hour
Pivot points : price is over resistance 2
Type : Neutral
Timeframe : 1 hour
Pivot points : price is over resistance 2
Type : Neutral
Timeframe : Weekly
The Central Patterns scanner, which studies chart patterns, resistances and supports, has identified these signals:
Near horizontal resistance
Type : Bearish
Timeframe : 1 hour
Resistance of channel is broken
Type : Bullish
Timeframe : 1 hour
No result was found by the Central Candlesticks scanner on Japanese candlesticks.
| S3 | S2 | S1 | Price | R1 | R2 | R3 | |
|---|---|---|---|---|---|---|---|
| ProTrendLines | 1.6454 | 1.6479 | 1.6510 | 1.6607 | 1.6703 | 1.6839 | 1.6993 |
| Change (%) | -0.92% | -0.77% | -0.58% | - | +0.58% | +1.40% | +2.32% |
| Change | -0.0153 | -0.0128 | -0.0097 | - | +0.0096 | +0.0232 | +0.0386 |
| Level | Minor | Minor | Major | - | Intermediate | Minor | Major |
Attention could also be paid to pivot points to set price objectives:
| Pivot points | S3 | S2 | S1 | PP | R1 | R2 | R3 |
|---|---|---|---|---|---|---|---|
| Standard | 1.6354 | 1.6384 | 1.6439 | 1.6469 | 1.6524 | 1.6554 | 1.6609 |
| Camarilla | 1.6471 | 1.6478 | 1.6486 | 1.6494 | 1.6502 | 1.6510 | 1.6517 |
| Woodie | 1.6367 | 1.6390 | 1.6452 | 1.6475 | 1.6537 | 1.6560 | 1.6622 |
| Fibonacci | 1.6384 | 1.6417 | 1.6437 | 1.6469 | 1.6502 | 1.6522 | 1.6554 |
| Pivot points | S3 | S2 | S1 | PP | R1 | R2 | R3 |
|---|---|---|---|---|---|---|---|
| Standard | 1.6234 | 1.6302 | 1.6383 | 1.6451 | 1.6532 | 1.6600 | 1.6681 |
| Camarilla | 1.6423 | 1.6437 | 1.6450 | 1.6464 | 1.6478 | 1.6491 | 1.6505 |
| Woodie | 1.6241 | 1.6305 | 1.6390 | 1.6454 | 1.6539 | 1.6603 | 1.6688 |
| Fibonacci | 1.6302 | 1.6359 | 1.6394 | 1.6451 | 1.6508 | 1.6543 | 1.6600 |
| Pivot points | S3 | S2 | S1 | PP | R1 | R2 | R3 |
|---|---|---|---|---|---|---|---|
| Standard | 1.6112 | 1.6276 | 1.6416 | 1.6580 | 1.6720 | 1.6884 | 1.7024 |
| Camarilla | 1.6472 | 1.6500 | 1.6528 | 1.6556 | 1.6584 | 1.6612 | 1.6640 |
| Woodie | 1.6100 | 1.6270 | 1.6404 | 1.6574 | 1.6708 | 1.6878 | 1.7012 |
| Fibonacci | 1.6276 | 1.6392 | 1.6464 | 1.6580 | 1.6696 | 1.6768 | 1.6884 |
Numerical data
The following are the details of the technical indicators and moving averages that were collected to generate this technical analysis:
| RSI (14): | 81.97 | |
| MACD (12,26,9): | 0.0030 | |
| Directional Movement: | 26.0481 | |
| AROON (14): | 92.8571 | |
| DEMA (21): | 1.6573 | |
| Parabolic SAR (0,02-0,02-0,2): | 1.6526 | |
| Elder Ray (13): | 0.0036 | |
| Super Trend (3,10): | 1.6526 | |
| Zig ZAG (10): | 1.6602 | |
| VORTEX (21): | 1.2967 | |
| Stochastique (14,3,5): | 89.81 | |
| TEMA (21): | 1.6588 | |
| Williams %R (14): | -4.13 | |
| Chande Momentum Oscillator (20): | 0.0066 | |
| Repulse (5,40,3): | 0.2379 | |
| ROCnROLL: | 1 | |
| TRIX (15,9): | 0.0234 | |
| Courbe Coppock: | 0.81 |
| MA7: | 1.6471 | |
| MA20: | 1.6516 | |
| MA50: | 1.6543 | |
| MA100: | 1.6469 | |
| MAexp7: | 1.6571 | |
| MAexp20: | 1.6534 | |
| MAexp50: | 1.6494 | |
| MAexp100: | 1.6472 | |
| Price / MA7: | +0.83% | |
| Price / MA20: | +0.55% | |
| Price / MA50: | +0.39% | |
| Price / MA100: | +0.84% | |
| Price / MAexp7: | +0.22% | |
| Price / MAexp20: | +0.44% | |
| Price / MAexp50: | +0.69% | |
| Price / MAexp100: | +0.82% |
News
The last news published on EUR/AUD at the time of the generation of this analysis was as follows:
-
 Both Dollar and S&P 500 Edge Higher after Factory Report, EURAUD A Pair to Watch
-
Weekly Technical Analysis: 19/08/2019 - GBPJPY, USDCAD, EURAUD
-
An Underappreciated Technical and Fundamental Appeal of EURAUD
-
Trading Sentiment: Poor for EUR, AUD and GBP | Webinar
-
EURAUD and EURCAD Weekly Trend Flow
About author

Online


Add a comment
Comments
0 comments on the analysis EUR/AUD - 1H