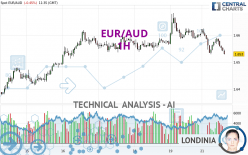
EUR/AUD - 1H - Technical analysis published on 04/22/2024 (GMT)
- 62
- 0
Click here for a new analysis!
- Timeframe : 1H
- - Analysis generated on
- Status : TARGET REACHED
Summary of the analysis

Additional analysis
Quotes
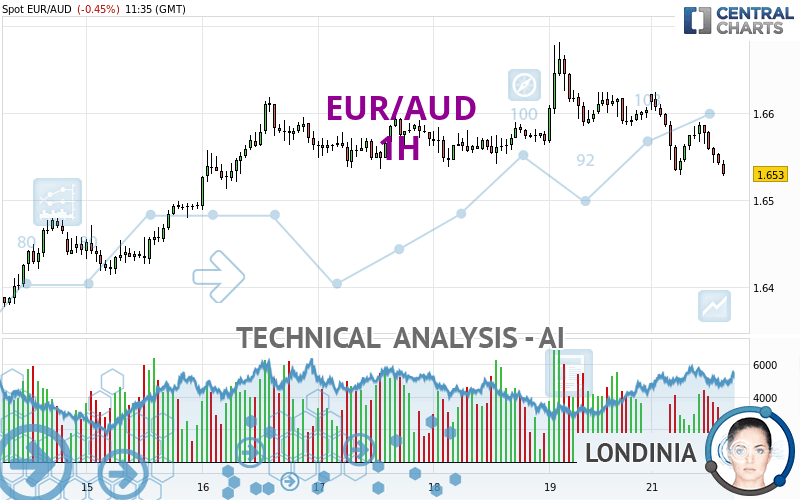
EUR/AUD rating 1.6530 AUD. The price registered a decrease of -0.45% on the session and was between 1.6528 AUD and 1.6624 AUD. This implies that the price is at +0.01% from its lowest and at -0.57% from its highest.The Central Gaps scanner detects a bullish opening marking the presence of buyers ahead of sellers at the opening but not sufficiently marked to allow the price to register a quotation gap.
Bullish opening
Type : Bullish
Timeframe : Openning
Here is a more detailed summary of the historical variations registered by EUR/AUD:
Near a new LOW record (1 year)
Type : Bearish
Timeframe : Weekly
Near a new LOW record (1st january)
Type : Bearish
Timeframe : Weekly
Near a new LOW record (1 month)
Type : Bearish
Timeframe : Weekly
Technical
Technical analysis of EUR/AUD in 1H shows a overall strongly bearish trend. 82.14% of the signals given by moving averages are bearish. This strongly bearish trend is supported by the strong bearish signals given by short-term moving averages. The Central Indicators scanner detects bearish signals on moving averages that could impact this trend:
Bearish trend reversal : Moving Average 100
Type : Bearish
Timeframe : 1 hour
Moving Average bearish crossovers : AMA20 & AMA50
Type : Bearish
Timeframe : 1 hour
Moving Average bearish crossovers : AMA50 & AMA100
Type : Bearish
Timeframe : 1 hour
In fact, according to the parameters integrated into the Central Analyzer system, 11 technical indicators out of 18 analysed are currently bearish. Caution: the Central Indicators scanner currently detects an excess:
CCI indicator is oversold : under -100
Type : Neutral
Timeframe : 1 hour
CCI indicator: bullish divergence
Type : Bullish
Timeframe : 1 hour
Williams %R indicator is oversold : under -80
Type : Neutral
Timeframe : 1 hour
Pivot points : price is under support 1
Type : Neutral
Timeframe : 1 hour
Price is back under the pivot point
Type : Bearish
Timeframe : Weekly
Central Patterns, the market scanner focusing on chart patterns, resistances and supports found these results:
Near horizontal support
Type : Bullish
Timeframe : 1 hour
Support of channel is broken
Type : Bearish
Timeframe : 1 hour
The Central Candlesticks scanner, specialised in Japanese candlesticks, did not identify any signals.
| S3 | S2 | S1 | Price | R1 | R2 | R3 | |
|---|---|---|---|---|---|---|---|
| ProTrendLines | 1.6279 | 1.6382 | 1.6498 | 1.6530 | 1.6537 | 1.6585 | 1.6615 |
| Change (%) | -1.52% | -0.90% | -0.19% | - | +0.04% | +0.33% | +0.51% |
| Change | -0.0251 | -0.0148 | -0.0032 | - | +0.0007 | +0.0055 | +0.0085 |
| Level | Major | Major | Intermediate | - | Intermediate | Intermediate | Intermediate |
To determine price objectives, it is also possible to use the pivot points. Here is the price position in relation to pivot points:
| Pivot points | S3 | S2 | S1 | PP | R1 | R2 | R3 |
|---|---|---|---|---|---|---|---|
| Standard | 1.6437 | 1.6501 | 1.6553 | 1.6617 | 1.6669 | 1.6733 | 1.6785 |
| Camarilla | 1.6572 | 1.6583 | 1.6593 | 1.6604 | 1.6615 | 1.6625 | 1.6636 |
| Woodie | 1.6430 | 1.6498 | 1.6546 | 1.6614 | 1.6662 | 1.6730 | 1.6778 |
| Fibonacci | 1.6501 | 1.6546 | 1.6573 | 1.6617 | 1.6662 | 1.6689 | 1.6733 |
| Pivot points | S3 | S2 | S1 | PP | R1 | R2 | R3 |
|---|---|---|---|---|---|---|---|
| Standard | 1.6183 | 1.6299 | 1.6451 | 1.6567 | 1.6719 | 1.6835 | 1.6987 |
| Camarilla | 1.6530 | 1.6555 | 1.6579 | 1.6604 | 1.6629 | 1.6653 | 1.6678 |
| Woodie | 1.6202 | 1.6308 | 1.6470 | 1.6576 | 1.6738 | 1.6844 | 1.7006 |
| Fibonacci | 1.6299 | 1.6401 | 1.6464 | 1.6567 | 1.6669 | 1.6732 | 1.6835 |
| Pivot points | S3 | S2 | S1 | PP | R1 | R2 | R3 |
|---|---|---|---|---|---|---|---|
| Standard | 1.6112 | 1.6276 | 1.6416 | 1.6580 | 1.6720 | 1.6884 | 1.7024 |
| Camarilla | 1.6472 | 1.6500 | 1.6528 | 1.6556 | 1.6584 | 1.6612 | 1.6640 |
| Woodie | 1.6100 | 1.6270 | 1.6404 | 1.6574 | 1.6708 | 1.6878 | 1.7012 |
| Fibonacci | 1.6276 | 1.6392 | 1.6464 | 1.6580 | 1.6696 | 1.6768 | 1.6884 |
Numerical data
The following is the status of technical indicators and moving averages registered at the time this technical analysis was created:
| RSI (14): | 35.48 | |
| MACD (12,26,9): | -0.0012 | |
| Directional Movement: | -10.2443 | |
| AROON (14): | -35.7143 | |
| DEMA (21): | 1.6557 | |
| Parabolic SAR (0,02-0,02-0,2): | 1.6535 | |
| Elder Ray (13): | -0.0024 | |
| Super Trend (3,10): | 1.6598 | |
| Zig ZAG (10): | 1.6538 | |
| VORTEX (21): | 0.8658 | |
| Stochastique (14,3,5): | 16.64 | |
| TEMA (21): | 1.6546 | |
| Williams %R (14): | -86.59 | |
| Chande Momentum Oscillator (20): | -0.0046 | |
| Repulse (5,40,3): | -0.0947 | |
| ROCnROLL: | 2 | |
| TRIX (15,9): | -0.0075 | |
| Courbe Coppock: | 0.48 |
| MA7: | 1.6543 | |
| MA20: | 1.6515 | |
| MA50: | 1.6545 | |
| MA100: | 1.6470 | |
| MAexp7: | 1.6555 | |
| MAexp20: | 1.6571 | |
| MAexp50: | 1.6578 | |
| MAexp100: | 1.6564 | |
| Price / MA7: | -0.08% | |
| Price / MA20: | +0.09% | |
| Price / MA50: | -0.09% | |
| Price / MA100: | +0.36% | |
| Price / MAexp7: | -0.15% | |
| Price / MAexp20: | -0.25% | |
| Price / MAexp50: | -0.29% | |
| Price / MAexp100: | -0.21% |
News
The last news published on EUR/AUD at the time of the generation of this analysis was as follows:
-
 Both Dollar and S&P 500 Edge Higher after Factory Report, EURAUD A Pair to Watch
-
Weekly Technical Analysis: 19/08/2019 - GBPJPY, USDCAD, EURAUD
-
An Underappreciated Technical and Fundamental Appeal of EURAUD
-
Trading Sentiment: Poor for EUR, AUD and GBP | Webinar
-
EURAUD and EURCAD Weekly Trend Flow
About author

Online


Add a comment
Comments
0 comments on the analysis EUR/AUD - 1H