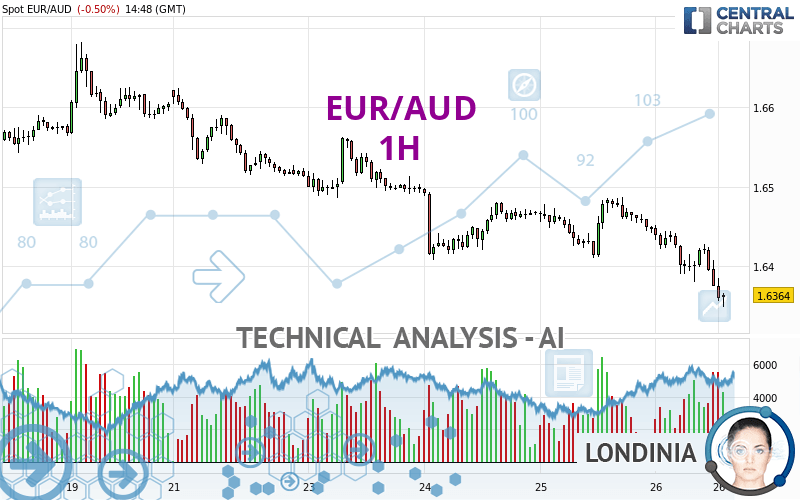
EUR/AUD - 1H - Technical analysis published on 04/26/2024 (GMT)
- 70
- 0
Click here for a new analysis!
- Timeframe : 1H
- - Analysis generated on
- Status : LEVEL MAINTAINED
Summary of the analysis

Additional analysis
Quotes
The EUR/AUD price is 1.6365 AUD. The price is lower by -0.50% since the last closing with the lowest point at 1.6349 AUD and the highest point at 1.6452 AUD. The deviation from the price is +0.10% for the low point and -0.53% for the high point.A bullish opening was detected by the Central Gaps scanner. Buyers are trying to impose a bullish momentum in the very short term.
Bullish opening
Type : Bullish
Timeframe : Openning
So that you have an overall view of the price change, here is a table showing the variations over several periods:
Near a new HIGH record (1 year)
Type : Bullish
Timeframe : Weekly
Near a new HIGH record (1st january)
Type : Bullish
Timeframe : Weekly
Near a new HIGH record (1 month)
Type : Bullish
Timeframe : Weekly
New LOW record (1 month)
Type : Bearish
Timeframe : Weekly
Technical
Technical analysis of this 1H chart of EUR/AUD indicates that the overall trend is strongly bearish. 92.86% of the signals given by moving averages are bearish. The overall trend is supported by the strong bearish signals from short-term moving averages. The Central Indicators scanner does not detect any result on moving averages that would impact this trend.
In fact, 11 technical indicators on 18 studied are currently positioned bearish. But beware of excesses. The Central Indicators scanner currently detects this:
RSI indicator is oversold : under 30
Type : Neutral
Timeframe : 1 hour
CCI indicator is oversold : under -100
Type : Neutral
Timeframe : 1 hour
CCI indicator: bullish divergence
Type : Bullish
Timeframe : 1 hour
RSI indicator: bullish divergence
Type : Bullish
Timeframe : 1 hour
Williams %R indicator is oversold : under -80
Type : Neutral
Timeframe : 1 hour
Pivot points : price is under support 1
Type : Neutral
Timeframe : Weekly
Pivot points : price is under support 3
Type : Neutral
Timeframe : 1 hour
The Central Patterns scanner, which studies chart patterns, resistances and supports, has identified these signals:
Near horizontal support
Type : Bullish
Timeframe : 1 hour
Support of channel is broken
Type : Bearish
Timeframe : 1 hour
The presence of a bullish Japanese candlestick pattern detected by Central Candlesticks that could cause a very short term rebound was also detected:
Bullish harami
Type : Bullish
Timeframe : 1 hour
| S3 | S2 | S1 | Price | R1 | R2 | R3 | |
|---|---|---|---|---|---|---|---|
| ProTrendLines | 1.5898 | 1.6172 | 1.6279 | 1.6365 | 1.6382 | 1.6409 | 1.6498 |
| Change (%) | -2.85% | -1.18% | -0.53% | - | +0.10% | +0.27% | +0.81% |
| Change | -0.0467 | -0.0193 | -0.0086 | - | +0.0017 | +0.0044 | +0.0133 |
| Level | Minor | Intermediate | Major | - | Intermediate | Intermediate | Intermediate |
To determine price objectives, it is also possible to use the pivot points. Here is the price position in relation to pivot points:
| Pivot points | S3 | S2 | S1 | PP | R1 | R2 | R3 |
|---|---|---|---|---|---|---|---|
| Standard | 1.6332 | 1.6371 | 1.6409 | 1.6448 | 1.6486 | 1.6525 | 1.6563 |
| Camarilla | 1.6426 | 1.6433 | 1.6440 | 1.6447 | 1.6454 | 1.6461 | 1.6468 |
| Woodie | 1.6332 | 1.6371 | 1.6409 | 1.6448 | 1.6486 | 1.6525 | 1.6563 |
| Fibonacci | 1.6371 | 1.6400 | 1.6419 | 1.6448 | 1.6477 | 1.6496 | 1.6525 |
| Pivot points | S3 | S2 | S1 | PP | R1 | R2 | R3 |
|---|---|---|---|---|---|---|---|
| Standard | 1.6183 | 1.6299 | 1.6451 | 1.6567 | 1.6719 | 1.6835 | 1.6987 |
| Camarilla | 1.6530 | 1.6555 | 1.6579 | 1.6604 | 1.6629 | 1.6653 | 1.6678 |
| Woodie | 1.6202 | 1.6308 | 1.6470 | 1.6576 | 1.6738 | 1.6844 | 1.7006 |
| Fibonacci | 1.6299 | 1.6401 | 1.6464 | 1.6567 | 1.6669 | 1.6732 | 1.6835 |
| Pivot points | S3 | S2 | S1 | PP | R1 | R2 | R3 |
|---|---|---|---|---|---|---|---|
| Standard | 1.6112 | 1.6276 | 1.6416 | 1.6580 | 1.6720 | 1.6884 | 1.7024 |
| Camarilla | 1.6472 | 1.6500 | 1.6528 | 1.6556 | 1.6584 | 1.6612 | 1.6640 |
| Woodie | 1.6100 | 1.6270 | 1.6404 | 1.6574 | 1.6708 | 1.6878 | 1.7012 |
| Fibonacci | 1.6276 | 1.6392 | 1.6464 | 1.6580 | 1.6696 | 1.6768 | 1.6884 |
Numerical data
The following are the details of the technical indicators and moving averages that were collected to generate this technical analysis:
| RSI (14): | 25.83 | |
| MACD (12,26,9): | -0.0021 | |
| Directional Movement: | -26.6841 | |
| AROON (14): | -100.0000 | |
| DEMA (21): | 1.6386 | |
| Parabolic SAR (0,02-0,02-0,2): | 1.6424 | |
| Elder Ray (13): | -0.0042 | |
| Super Trend (3,10): | 1.6423 | |
| Zig ZAG (10): | 1.6357 | |
| VORTEX (21): | 0.7312 | |
| Stochastique (14,3,5): | 5.21 | |
| TEMA (21): | 1.6374 | |
| Williams %R (14): | -85.42 | |
| Chande Momentum Oscillator (20): | -0.0071 | |
| Repulse (5,40,3): | -0.1507 | |
| ROCnROLL: | 2 | |
| TRIX (15,9): | -0.0126 | |
| Courbe Coppock: | 0.75 |
| MA7: | 1.6494 | |
| MA20: | 1.6489 | |
| MA50: | 1.6537 | |
| MA100: | 1.6471 | |
| MAexp7: | 1.6385 | |
| MAexp20: | 1.6411 | |
| MAexp50: | 1.6438 | |
| MAexp100: | 1.6464 | |
| Price / MA7: | -0.78% | |
| Price / MA20: | -0.75% | |
| Price / MA50: | -1.04% | |
| Price / MA100: | -0.64% | |
| Price / MAexp7: | -0.13% | |
| Price / MAexp20: | -0.29% | |
| Price / MAexp50: | -0.45% | |
| Price / MAexp100: | -0.61% |
News
The latest news and videos published on EUR/AUD at the time of the analysis were as follows:
-
 Both Dollar and S&P 500 Edge Higher after Factory Report, EURAUD A Pair to Watch
-
Weekly Technical Analysis: 19/08/2019 - GBPJPY, USDCAD, EURAUD
-
An Underappreciated Technical and Fundamental Appeal of EURAUD
-
Trading Sentiment: Poor for EUR, AUD and GBP | Webinar
-
EURAUD and EURCAD Weekly Trend Flow
About author

Online


Add a comment
Comments
0 comments on the analysis EUR/AUD - 1H