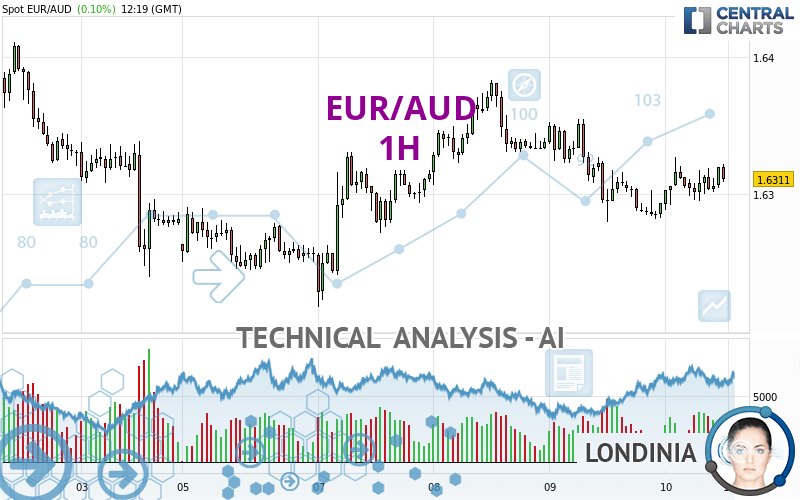
EUR/AUD - 1H - Technical analysis published on 05/10/2024 (GMT)
- 52
- 0
- Timeframe : 1H
- - Analysis generated on
- Status : NEUTRAL

Summary of the analysis

Additional analysis
Quotes
The EUR/AUD rating is 1.6311 AUD. The price has increased by +0.10% since the last closing and was traded between 1.6289 AUD and 1.6327 AUD over the period. The price is currently at +0.14% from its lowest and -0.10% from its highest.A bearish opening was detected by the Central Gaps scanner. Sellers are trying to impose a bearish trend in the very short term.
Bearish opening
Type : Bearish
Timeframe : Openning
A study of price movements over other periods shows the following variations:
Near a new HIGH record (1 year)
Type : Bullish
Timeframe : Weekly
Near a new HIGH record (1st january)
Type : Bullish
Timeframe : Weekly
Near a new HIGH record (1 month)
Type : Bullish
Timeframe : Weekly
Technical
Technical analysis of this 1H chart of EUR/AUD indicates that the overall trend is slightly bullish. Only 50.00% of the signals given by moving averages are bullish. This slightly bullish trend could return to neutral given the neutral signals also given by short-term moving averages. An assessment of moving averages reveals several bearish and bullish signals:
Bullish trend reversal : adaptative moving average 20
Type : Bullish
Timeframe : 1 hour
Bullish trend reversal : adaptative moving average 50
Type : Bullish
Timeframe : 1 hour
Bullish trend reversal : adaptative moving average 100
Type : Bullish
Timeframe : 1 hour
Bullish price crossover with Moving Average 50
Type : Bullish
Timeframe : 1 hour
Bearish price crossover with adaptative moving average 20
Type : Bearish
Timeframe : 1 hour
Bearish price crossover with adaptative moving average 50
Type : Bearish
Timeframe : 1 hour
In fact, according to the parameters integrated into the Central Analyzer system, 14 technical indicators out of 18 analysed are currently bullish. But beware of excesses. The Central Indicators scanner currently detects this:
CCI indicator is overbought : over 100
Type : Neutral
Timeframe : 1 hour
RSI indicator: bearish divergence
Type : Bearish
Timeframe : 1 hour
MACD indicator is back over 0
Type : Bullish
Timeframe : 1 hour
An analysis of the price chart with the Central Patterns scanner (detector of chart patterns and resistances and supports) shows several results that can have an impact on the price change:
Near horizontal resistance
Type : Bearish
Timeframe : 1 hour
Resistance of channel is broken
Type : Bullish
Timeframe : 1 hour
The Central Candlesticks scanner currently notes the presence of this pattern in Japanese candlesticks that could mark the end of the short-term trend currently underway:
Doji
Type : Neutral
Timeframe : 1 hour
| S3 | S2 | S1 | Price | R1 | R2 | R3 | |
|---|---|---|---|---|---|---|---|
| ProTrendLines | 1.6218 | 1.6240 | 1.6279 | 1.6311 | 1.6355 | 1.6382 | 1.6443 |
| Change (%) | -0.57% | -0.44% | -0.20% | - | +0.27% | +0.44% | +0.81% |
| Change | -0.0093 | -0.0071 | -0.0032 | - | +0.0044 | +0.0071 | +0.0132 |
| Level | Minor | Minor | Major | - | Major | Major | Minor |
To determine price objectives, it is also possible to use the pivot points. Here is the price position in relation to pivot points:
| Pivot points | S3 | S2 | S1 | PP | R1 | R2 | R3 |
|---|---|---|---|---|---|---|---|
| Standard | 1.6189 | 1.6235 | 1.6264 | 1.6310 | 1.6339 | 1.6385 | 1.6414 |
| Camarilla | 1.6273 | 1.6280 | 1.6287 | 1.6294 | 1.6301 | 1.6308 | 1.6315 |
| Woodie | 1.6182 | 1.6231 | 1.6257 | 1.6306 | 1.6332 | 1.6381 | 1.6407 |
| Fibonacci | 1.6235 | 1.6263 | 1.6281 | 1.6310 | 1.6338 | 1.6356 | 1.6385 |
| Pivot points | S3 | S2 | S1 | PP | R1 | R2 | R3 |
|---|---|---|---|---|---|---|---|
| Standard | 1.5924 | 1.6082 | 1.6182 | 1.6340 | 1.6440 | 1.6598 | 1.6698 |
| Camarilla | 1.6211 | 1.6235 | 1.6258 | 1.6282 | 1.6306 | 1.6329 | 1.6353 |
| Woodie | 1.5895 | 1.6068 | 1.6153 | 1.6326 | 1.6411 | 1.6584 | 1.6669 |
| Fibonacci | 1.6082 | 1.6181 | 1.6241 | 1.6340 | 1.6439 | 1.6499 | 1.6598 |
| Pivot points | S3 | S2 | S1 | PP | R1 | R2 | R3 |
|---|---|---|---|---|---|---|---|
| Standard | 1.5891 | 1.6091 | 1.6282 | 1.6482 | 1.6673 | 1.6873 | 1.7064 |
| Camarilla | 1.6366 | 1.6401 | 1.6437 | 1.6473 | 1.6509 | 1.6545 | 1.6581 |
| Woodie | 1.5887 | 1.6089 | 1.6278 | 1.6480 | 1.6669 | 1.6871 | 1.7060 |
| Fibonacci | 1.6091 | 1.6240 | 1.6333 | 1.6482 | 1.6631 | 1.6724 | 1.6873 |
Numerical data
The following are the details of the technical indicators and moving averages that were collected to generate this technical analysis:
| RSI (14): | 55.31 | |
| MACD (12,26,9): | 0.0000 | |
| Directional Movement: | 11.3237 | |
| AROON (14): | 28.5714 | |
| DEMA (21): | 1.6307 | |
| Parabolic SAR (0,02-0,02-0,2): | 1.6300 | |
| Elder Ray (13): | 0.0010 | |
| Super Trend (3,10): | 1.6326 | |
| Zig ZAG (10): | 1.6320 | |
| VORTEX (21): | 1.0389 | |
| Stochastique (14,3,5): | 71.68 | |
| TEMA (21): | 1.6311 | |
| Williams %R (14): | -22.73 | |
| Chande Momentum Oscillator (20): | 0.0014 | |
| Repulse (5,40,3): | 0.0396 | |
| ROCnROLL: | 1 | |
| TRIX (15,9): | -0.0032 | |
| Courbe Coppock: | 0.20 |
| MA7: | 1.6304 | |
| MA20: | 1.6422 | |
| MA50: | 1.6493 | |
| MA100: | 1.6472 | |
| MAexp7: | 1.6310 | |
| MAexp20: | 1.6309 | |
| MAexp50: | 1.6312 | |
| MAexp100: | 1.6316 | |
| Price / MA7: | +0.04% | |
| Price / MA20: | -0.68% | |
| Price / MA50: | -1.10% | |
| Price / MA100: | -0.98% | |
| Price / MAexp7: | +0.01% | |
| Price / MAexp20: | +0.01% | |
| Price / MAexp50: | -0.01% | |
| Price / MAexp100: | -0.03% |
News
The last news published on EUR/AUD at the time of the generation of this analysis was as follows:
-
 Both Dollar and S&P 500 Edge Higher after Factory Report, EURAUD A Pair to Watch
-
Weekly Technical Analysis: 19/08/2019 - GBPJPY, USDCAD, EURAUD
-
An Underappreciated Technical and Fundamental Appeal of EURAUD
-
Trading Sentiment: Poor for EUR, AUD and GBP | Webinar
-
EURAUD and EURCAD Weekly Trend Flow
About author

Online


Add a comment
Comments
0 comments on the analysis EUR/AUD - 1H