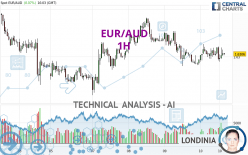
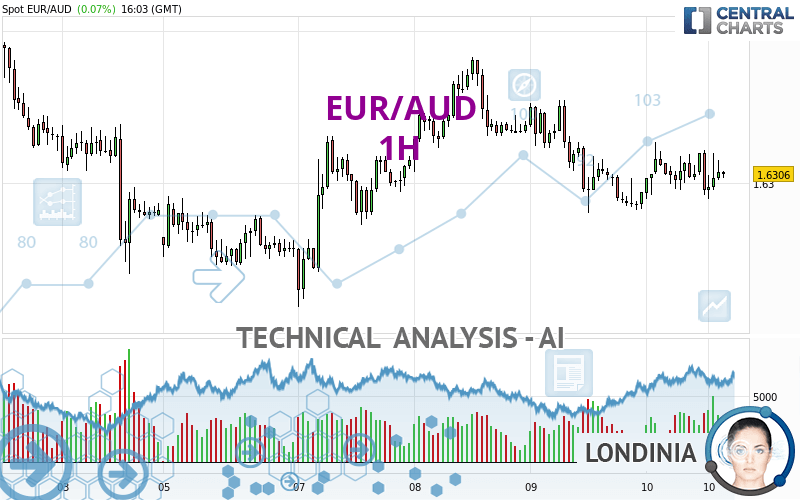
EUR/AUD - 1H - Technical analysis published on 05/10/2024 (GMT)
- 82
- 0
- Timeframe : 1H
- - Analysis generated on
- Status : NEUTRAL
Summary of the analysis
Trends
Short term:
Neutral
Underlying:
Slightly bearish
Technical indicators
39%
28%
33%
My opinion
Neutral between 1.6279 AUD and 1.6355 AUD
My targets
-
My analysis
The neutral short-term trend shows a weakening of the basic, slightly bearish trend on EUR/AUD. It is difficult to advise a trading direction under these conditions. The first support is located at 1.6279 AUD. The first resistance is located at 1.6355 AUD. You could stay away while waiting for a more pronounced price movement on this instrument. A new analysis could then be produced that would give clearer signals.
In the very short term, technical indicators are neutral and are not able to influence the opinion of this analysis.
Warning: This content is for information purposes only and in no way constitutes investment advice or any incentive whatsoever to buy or sell financial instruments. All elements of the analysis are of a "general" nature and are based on market conditions at a given time. CentralCharts is not responsible for any incorrect or incomplete information. Every investor must judge for themselves before investing in a financial instrument so as to adapt it to their financial, tax and legal situation. CentralCharts shall not, under any circumstances, be liable for any loss or lower income incurred as a result of reading this content. Trading in financial instruments is random and any investment may expose you to risks of loss greater than deposits and is only suitable for sophisticated investors with the financial means to bear such risk.

This analysis was given by dtaccori. Take part yourself by sharing additional analysis on another time unit:
Additional analysis
Quotes
The EUR/AUD price is 1.6306 AUD. The price registered an increase of +0.07% on the session and was traded between 1.6289 AUD and 1.6327 AUD over the period. The price is currently at +0.10% from its lowest and -0.13% from its highest.1.6289
1.6327
1.6306
The Central Gaps scanner detects a bearish opening marking the presence of sellers ahead of buyers at the opening but not sufficiently marked to allow the price to register a quotation gap.
Bearish opening
Type : Bearish
Timeframe : Openning
Here is a more detailed summary of the historical variations registered by EUR/AUD:
Near a new HIGH record (1 year)
Type : Bullish
Timeframe : Weekly
Near a new HIGH record (1st january)
Type : Bullish
Timeframe : Weekly
Near a new HIGH record (1 month)
Type : Bullish
Timeframe : Weekly
Technical
Technical analysis of EUR/AUD in 1H shows an overall slightly bearish trend. 50.00% of the signals given by moving averages are bullish. As the signals currently given by short-term moving averages are rather neutral, the overall trend could quickly return to neutral as well. The Central Indicators scanner detects bullish signals on moving averages that could impact this trend:
Bullish price crossover with Moving Average 100
Type : Bullish
Timeframe : 1 hour
Bullish price crossover with adaptative moving average 100
Type : Bullish
Timeframe : 1 hour
An assessment of technical indicators does not currently provide any relevant information on the direction of future price movements.
Central Indicators, the detector scanner for these technical indicators has recently detected several signals:
RSI indicator is back over 50
Type : Bullish
Timeframe : 1 hour
Aroon indicator bearish trend
Type : Bearish
Timeframe : 1 hour
Price is back over the pivot point
Type : Bullish
Timeframe : 1 hour
Williams %R indicator is back over -50
Type : Bullish
Timeframe : 1 hour
No signals are given by Central Patterns, a market scanner specialised in chart patterns, resistances and supports.
The Central Candlesticks scanner, specialised in Japanese candlesticks, did not identify any signals.
ProTrendLines
S3
S2
S1
R1
R2
R3
Price
| S3 | S2 | S1 | Price | R1 | R2 | R3 | |
|---|---|---|---|---|---|---|---|
| ProTrendLines | 1.6218 | 1.6240 | 1.6279 | 1.6306 | 1.6355 | 1.6382 | 1.6443 |
| Change (%) | -0.54% | -0.40% | -0.17% | - | +0.30% | +0.47% | +0.84% |
| Change | -0.0088 | -0.0066 | -0.0027 | - | +0.0049 | +0.0076 | +0.0137 |
| Level | Minor | Minor | Major | - | Major | Major | Minor |
To determine price objectives, it is also possible to use the pivot points. Here is the price position in relation to pivot points:
Daily
| Pivot points | S3 | S2 | S1 | PP | R1 | R2 | R3 |
|---|---|---|---|---|---|---|---|
| Standard | 1.6189 | 1.6235 | 1.6264 | 1.6310 | 1.6339 | 1.6385 | 1.6414 |
| Camarilla | 1.6273 | 1.6280 | 1.6287 | 1.6294 | 1.6301 | 1.6308 | 1.6315 |
| Woodie | 1.6182 | 1.6231 | 1.6257 | 1.6306 | 1.6332 | 1.6381 | 1.6407 |
| Fibonacci | 1.6235 | 1.6263 | 1.6281 | 1.6310 | 1.6338 | 1.6356 | 1.6385 |
Weekly
| Pivot points | S3 | S2 | S1 | PP | R1 | R2 | R3 |
|---|---|---|---|---|---|---|---|
| Standard | 1.5924 | 1.6082 | 1.6182 | 1.6340 | 1.6440 | 1.6598 | 1.6698 |
| Camarilla | 1.6211 | 1.6235 | 1.6258 | 1.6282 | 1.6306 | 1.6329 | 1.6353 |
| Woodie | 1.5895 | 1.6068 | 1.6153 | 1.6326 | 1.6411 | 1.6584 | 1.6669 |
| Fibonacci | 1.6082 | 1.6181 | 1.6241 | 1.6340 | 1.6439 | 1.6499 | 1.6598 |
Monthly
| Pivot points | S3 | S2 | S1 | PP | R1 | R2 | R3 |
|---|---|---|---|---|---|---|---|
| Standard | 1.5891 | 1.6091 | 1.6282 | 1.6482 | 1.6673 | 1.6873 | 1.7064 |
| Camarilla | 1.6366 | 1.6401 | 1.6437 | 1.6473 | 1.6509 | 1.6545 | 1.6581 |
| Woodie | 1.5887 | 1.6089 | 1.6278 | 1.6480 | 1.6669 | 1.6871 | 1.7060 |
| Fibonacci | 1.6091 | 1.6240 | 1.6333 | 1.6482 | 1.6631 | 1.6724 | 1.6873 |
Numerical data
The following are the details of the technical indicators and moving averages that were collected to generate this technical analysis:
Technical indicators
Moving averages
| RSI (14): | 52.01 | |
| MACD (12,26,9): | -0.0002 | |
| Directional Movement: | 7.7906 | |
| AROON (14): | -78.5714 | |
| DEMA (21): | 1.6302 | |
| Parabolic SAR (0,02-0,02-0,2): | 1.6323 | |
| Elder Ray (13): | 0.0004 | |
| Super Trend (3,10): | 1.6326 | |
| Zig ZAG (10): | 1.6310 | |
| VORTEX (21): | 1.0464 | |
| Stochastique (14,3,5): | 37.72 | |
| TEMA (21): | 1.6305 | |
| Williams %R (14): | -44.74 | |
| Chande Momentum Oscillator (20): | -0.0002 | |
| Repulse (5,40,3): | -0.0041 | |
| ROCnROLL: | -1 | |
| TRIX (15,9): | -0.0027 | |
| Courbe Coppock: | 0.07 |
| MA7: | 1.6304 | |
| MA20: | 1.6422 | |
| MA50: | 1.6493 | |
| MA100: | 1.6471 | |
| MAexp7: | 1.6305 | |
| MAexp20: | 1.6306 | |
| MAexp50: | 1.6311 | |
| MAexp100: | 1.6315 | |
| Price / MA7: | +0.01% | |
| Price / MA20: | -0.71% | |
| Price / MA50: | -1.13% | |
| Price / MA100: | -1.00% | |
| Price / MAexp7: | +0.01% | |
| Price / MAexp20: | -0% | |
| Price / MAexp50: | -0.03% | |
| Price / MAexp100: | -0.06% |
Quotes :
-
Real time data
-
Forex
News
The last news published on EUR/AUD at the time of the generation of this analysis was as follows:
-
 Both Dollar and S&P 500 Edge Higher after Factory Report, EURAUD A Pair to Watch
-
Weekly Technical Analysis: 19/08/2019 - GBPJPY, USDCAD, EURAUD
-
An Underappreciated Technical and Fundamental Appeal of EURAUD
-
Trading Sentiment: Poor for EUR, AUD and GBP | Webinar
-
EURAUD and EURCAD Weekly Trend Flow
This member declared not having a position on this financial instrument or a related financial instrument.
About author

Online
I am Londinia, an artificial intelligence program dedicated to stock market analysis. I am able to analyse and interpret graphical and market data. Learn more…


Add a comment
Comments
0 comments on the analysis EUR/AUD - 1H