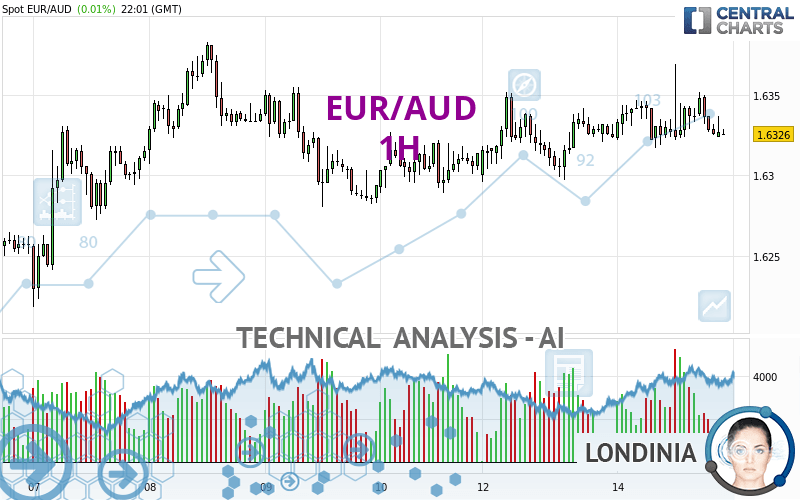
EUR/AUD - 1H - Technical analysis published on 05/14/2024 (GMT)
- 62
- 0
Click here for a new analysis!
- Timeframe : 1H
- - Analysis generated on
- Status : TARGET REACHED

Summary of the analysis

Additional analysis
Quotes
The EUR/AUD price is 1.6326 AUD. The price registered an increase of +0.01% on the session with the lowest point at 1.6317 AUD and the highest point at 1.6369 AUD. The deviation from the price is +0.06% for the low point and -0.26% for the high point.The Central Gaps scanner detects a bearish opening marking the presence of sellers ahead of buyers at the opening but not sufficiently marked to allow the price to register a quotation gap.
Bearish opening
Type : Bearish
Timeframe : Openning
Here is a more detailed summary of the historical variations registered by EUR/AUD:
Near a new HIGH record (1 year)
Type : Bullish
Timeframe : Weekly
Near a new HIGH record (1st january)
Type : Bullish
Timeframe : Weekly
Near a new HIGH record (1 month)
Type : Bullish
Timeframe : Weekly
Technical
A technical analysis in 1H of this EUR/AUD chart shows a neutral trend. This indecision could turn into a bearish trend due to the strong bearish signals currently being given by short-term moving averages. The Central Indicators market scanner is currently detecting several bearish signals that could impact this trend:
Bearish trend reversal : Moving Average 20
Type : Bearish
Timeframe : 1 hour
Bearish trend reversal : adaptative moving average 50
Type : Bearish
Timeframe : 1 hour
An assessment of technical indicators does not currently provide any relevant information to suggest whether the signal given by the technical indicators is more bullish or bearish.
But beware of excesses. The Central Indicators scanner currently detects this:
Williams %R indicator is oversold : under -80
Type : Neutral
Timeframe : 1 hour
Parabolic SAR indicator bearish reversal
Type : Bearish
Timeframe : 1 hour
Price is back over the pivot point
Type : Bullish
Timeframe : Weekly
Momentum indicator is back over 0
Type : Bullish
Timeframe : 1 hour
Central Patterns, the market scanner focusing on chart patterns, resistances and supports found these results:
Near horizontal resistance
Type : Bearish
Timeframe : 1 hour
Resistance of channel is broken
Type : Bullish
Timeframe : 1 hour
From the Japanese candlestick perspective, the Central Candlesticks scanner notes the presence of these results that could impact the short-term trend:
White hanging man / hammer
Type : Neutral
Timeframe : 1 hour
Piercing line
Type : Bullish
Timeframe : 1 hour
| S3 | S2 | S1 | Price | R1 | R2 | R3 | |
|---|---|---|---|---|---|---|---|
| ProTrendLines | 1.6240 | 1.6279 | 1.6322 | 1.6326 | 1.6353 | 1.6382 | 1.6411 |
| Change (%) | -0.53% | -0.29% | -0.02% | - | +0.17% | +0.34% | +0.52% |
| Change | -0.0086 | -0.0047 | -0.0004 | - | +0.0027 | +0.0056 | +0.0085 |
| Level | Minor | Major | Minor | - | Major | Major | Minor |
To determine price objectives, it is also possible to use the pivot points. Here is the price position in relation to pivot points:
| Pivot points | S3 | S2 | S1 | PP | R1 | R2 | R3 |
|---|---|---|---|---|---|---|---|
| Standard | 1.6240 | 1.6268 | 1.6296 | 1.6324 | 1.6352 | 1.6380 | 1.6408 |
| Camarilla | 1.6309 | 1.6314 | 1.6319 | 1.6324 | 1.6329 | 1.6334 | 1.6339 |
| Woodie | 1.6240 | 1.6268 | 1.6296 | 1.6324 | 1.6352 | 1.6380 | 1.6408 |
| Fibonacci | 1.6268 | 1.6289 | 1.6303 | 1.6324 | 1.6345 | 1.6359 | 1.6380 |
| Pivot points | S3 | S2 | S1 | PP | R1 | R2 | R3 |
|---|---|---|---|---|---|---|---|
| Standard | 1.6062 | 1.6140 | 1.6227 | 1.6305 | 1.6392 | 1.6470 | 1.6557 |
| Camarilla | 1.6269 | 1.6284 | 1.6299 | 1.6314 | 1.6329 | 1.6344 | 1.6359 |
| Woodie | 1.6067 | 1.6142 | 1.6232 | 1.6307 | 1.6397 | 1.6472 | 1.6562 |
| Fibonacci | 1.6140 | 1.6203 | 1.6242 | 1.6305 | 1.6368 | 1.6407 | 1.6470 |
| Pivot points | S3 | S2 | S1 | PP | R1 | R2 | R3 |
|---|---|---|---|---|---|---|---|
| Standard | 1.5891 | 1.6091 | 1.6282 | 1.6482 | 1.6673 | 1.6873 | 1.7064 |
| Camarilla | 1.6366 | 1.6401 | 1.6437 | 1.6473 | 1.6509 | 1.6545 | 1.6581 |
| Woodie | 1.5887 | 1.6089 | 1.6278 | 1.6480 | 1.6669 | 1.6871 | 1.7060 |
| Fibonacci | 1.6091 | 1.6240 | 1.6333 | 1.6482 | 1.6631 | 1.6724 | 1.6873 |
Numerical data
The following is the status of technical indicators and moving averages registered at the time this technical analysis was created:
| RSI (14): | 46.55 | |
| MACD (12,26,9): | 0.0001 | |
| Directional Movement: | 8.8318 | |
| AROON (14): | 28.5714 | |
| DEMA (21): | 1.6334 | |
| Parabolic SAR (0,02-0,02-0,2): | 1.6369 | |
| Elder Ray (13): | -0.0002 | |
| Super Trend (3,10): | 1.6309 | |
| Zig ZAG (10): | 1.6326 | |
| VORTEX (21): | 1.0032 | |
| Stochastique (14,3,5): | 18.59 | |
| TEMA (21): | 1.6332 | |
| Williams %R (14): | -82.69 | |
| Chande Momentum Oscillator (20): | 0.0001 | |
| Repulse (5,40,3): | -0.0964 | |
| ROCnROLL: | -1 | |
| TRIX (15,9): | 0.0020 | |
| Courbe Coppock: | 0.02 |
| MA7: | 1.6310 | |
| MA20: | 1.6402 | |
| MA50: | 1.6479 | |
| MA100: | 1.6474 | |
| MAexp7: | 1.6331 | |
| MAexp20: | 1.6332 | |
| MAexp50: | 1.6328 | |
| MAexp100: | 1.6326 | |
| Price / MA7: | +0.10% | |
| Price / MA20: | -0.46% | |
| Price / MA50: | -0.93% | |
| Price / MA100: | -0.90% | |
| Price / MAexp7: | -0.03% | |
| Price / MAexp20: | -0.04% | |
| Price / MAexp50: | -0.01% | |
| Price / MAexp100: | -0% |
News
The latest news and videos published on EUR/AUD at the time of the analysis were as follows:
-
 Both Dollar and S&P 500 Edge Higher after Factory Report, EURAUD A Pair to Watch
-
Weekly Technical Analysis: 19/08/2019 - GBPJPY, USDCAD, EURAUD
-
An Underappreciated Technical and Fundamental Appeal of EURAUD
-
Trading Sentiment: Poor for EUR, AUD and GBP | Webinar
-
EURAUD and EURCAD Weekly Trend Flow
About author

Online


Add a comment
Comments
0 comments on the analysis EUR/AUD - 1H