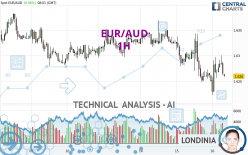
EUR/AUD - 1H - Technical analysis published on 05/16/2024 (GMT)
- 63
- 0
Oops, I was wrong about that analysis. My threshold for invalidation has been broken.
Click here for a new analysis!
Click here for a new analysis!
- Timeframe : 1H
- - Analysis generated on
- Status : INVALID

Summary of the analysis
Trends
Short term:
Strongly bearish
Underlying:
Strongly bearish
Technical indicators
39%
11%
50%
My opinion
Bearish under 1.6279 AUD
My targets
1.6218 AUD (-0.0042)
1.6172 AUD (-0.0088)
My analysis
EUR/AUD is part of a very strong bearish trend. Traders may consider trading only short positions (for sale) as long as the price remains well below 1.6279 AUD. The next support located at 1.6218 AUD is the next bearish objective to target. A bearish break of this support would revive the bearish momentum. The bearish movement could then continue towards the next support located at 1.6172 AUD. Below this support, sellers could then target 1.5898 AUD. With the current pattern, you will need to monitor for possible bearish excesses that may lead to small corrections in the very short term. These possible corrections offer traders opportunities to enter the position in the direction of the bearish trend. Trying to profit from the purchase of these possible corrections may seem risky.
Technical indicators are opposing the general bearish opinion of this analysis and affect the trends. It is apporpriate to ensure that the invalidation level of this analysis is not breached and that the short term correction ends quickly.
Force
0
10
5.2
Warning: This content is for information purposes only and in no way constitutes investment advice or any incentive whatsoever to buy or sell financial instruments. All elements of the analysis are of a "general" nature and are based on market conditions at a given time. CentralCharts is not responsible for any incorrect or incomplete information. Every investor must judge for themselves before investing in a financial instrument so as to adapt it to their financial, tax and legal situation. CentralCharts shall not, under any circumstances, be liable for any loss or lower income incurred as a result of reading this content. Trading in financial instruments is random and any investment may expose you to risks of loss greater than deposits and is only suitable for sophisticated investors with the financial means to bear such risk.

This analysis was given by dtaccori. Take part yourself by sharing additional analysis on another time unit:
Additional analysis
Quotes
The EUR/AUD rating is 1.6260 AUD. On the day, this instrument gained +0.06% with the lowest point at 1.6223 AUD and the highest point at 1.6301 AUD. The deviation from the price is +0.23% for the low point and -0.25% for the high point.1.6223
1.6301
1.6260
A bullish opening was detected by the Central Gaps scanner. Buyers are trying to impose a bullish momentum in the very short term.
Bullish opening
Type : Bullish
Timeframe : Openning
Here is a more detailed summary of the historical variations registered by EUR/AUD:
Near a new HIGH record (1 year)
Type : Bullish
Timeframe : Weekly
Near a new HIGH record (1st january)
Type : Bullish
Timeframe : Weekly
Near a new HIGH record (1 month)
Type : Bullish
Timeframe : Weekly
Technical
Technical analysis of EUR/AUD in 1H shows a overall strongly bearish trend. 92.86% of the signals given by moving averages are bearish. This strongly bearish trend is supported by the strong bearish signals given by short-term moving averages. The Central Indicators market scanner is currently detecting a bearish signal that could impact this trend:
Bearish price crossover with Moving Average 20
Type : Bearish
Timeframe : 1 hour
The probability of a further increase is slight given the direction of the technical indicators.
Central Indicators, the detector scanner for these technical indicators has recently detected several signals:
RSI indicator is back under 50
Type : Bearish
Timeframe : 1 hour
Price is back under the pivot point
Type : Bearish
Timeframe : 1 hour
The analysis of the price chart with Central Patterns scanners does not return any result.
The Central Candlesticks scanner which studies Japanese candlesticks did not detect anything.
ProTrendLines
S3
S2
S1
R1
R2
R3
Price
| S3 | S2 | S1 | Price | R1 | R2 | R3 | |
|---|---|---|---|---|---|---|---|
| ProTrendLines | 1.6172 | 1.6218 | 1.6248 | 1.6260 | 1.6279 | 1.6331 | 1.6352 |
| Change (%) | -0.54% | -0.26% | -0.07% | - | +0.12% | +0.44% | +0.57% |
| Change | -0.0088 | -0.0042 | -0.0012 | - | +0.0019 | +0.0071 | +0.0092 |
| Level | Intermediate | Minor | Intermediate | - | Major | Minor | Intermediate |
Pivot points can also be used to set your price objectives. Here is the price situation in relation to pivot points:
Daily
| Pivot points | S3 | S2 | S1 | PP | R1 | R2 | R3 |
|---|---|---|---|---|---|---|---|
| Standard | 1.6123 | 1.6186 | 1.6218 | 1.6281 | 1.6313 | 1.6376 | 1.6408 |
| Camarilla | 1.6225 | 1.6234 | 1.6242 | 1.6251 | 1.6260 | 1.6268 | 1.6277 |
| Woodie | 1.6109 | 1.6178 | 1.6204 | 1.6273 | 1.6299 | 1.6368 | 1.6394 |
| Fibonacci | 1.6186 | 1.6222 | 1.6244 | 1.6281 | 1.6317 | 1.6339 | 1.6376 |
Weekly
| Pivot points | S3 | S2 | S1 | PP | R1 | R2 | R3 |
|---|---|---|---|---|---|---|---|
| Standard | 1.6062 | 1.6140 | 1.6227 | 1.6305 | 1.6392 | 1.6470 | 1.6557 |
| Camarilla | 1.6269 | 1.6284 | 1.6299 | 1.6314 | 1.6329 | 1.6344 | 1.6359 |
| Woodie | 1.6067 | 1.6142 | 1.6232 | 1.6307 | 1.6397 | 1.6472 | 1.6562 |
| Fibonacci | 1.6140 | 1.6203 | 1.6242 | 1.6305 | 1.6368 | 1.6407 | 1.6470 |
Monthly
| Pivot points | S3 | S2 | S1 | PP | R1 | R2 | R3 |
|---|---|---|---|---|---|---|---|
| Standard | 1.5891 | 1.6091 | 1.6282 | 1.6482 | 1.6673 | 1.6873 | 1.7064 |
| Camarilla | 1.6366 | 1.6401 | 1.6437 | 1.6473 | 1.6509 | 1.6545 | 1.6581 |
| Woodie | 1.5887 | 1.6089 | 1.6278 | 1.6480 | 1.6669 | 1.6871 | 1.7060 |
| Fibonacci | 1.6091 | 1.6240 | 1.6333 | 1.6482 | 1.6631 | 1.6724 | 1.6873 |
Numerical data
The following is the status of technical indicators and moving averages registered at the time this technical analysis was created:
Technical indicators
Moving averages
| RSI (14): | 47.01 | |
| MACD (12,26,9): | -0.0007 | |
| Directional Movement: | -1.9970 | |
| AROON (14): | 42.8571 | |
| DEMA (21): | 1.6265 | |
| Parabolic SAR (0,02-0,02-0,2): | 1.6232 | |
| Elder Ray (13): | 0.0004 | |
| Super Trend (3,10): | 1.6305 | |
| Zig ZAG (10): | 1.6272 | |
| VORTEX (21): | 0.9501 | |
| Stochastique (14,3,5): | 75.34 | |
| TEMA (21): | 1.6269 | |
| Williams %R (14): | -35.90 | |
| Chande Momentum Oscillator (20): | 0.0013 | |
| Repulse (5,40,3): | -0.0835 | |
| ROCnROLL: | 2 | |
| TRIX (15,9): | -0.0101 | |
| Courbe Coppock: | 0.04 |
| MA7: | 1.6302 | |
| MA20: | 1.6371 | |
| MA50: | 1.6466 | |
| MA100: | 1.6475 | |
| MAexp7: | 1.6274 | |
| MAexp20: | 1.6276 | |
| MAexp50: | 1.6292 | |
| MAexp100: | 1.6303 | |
| Price / MA7: | -0.26% | |
| Price / MA20: | -0.68% | |
| Price / MA50: | -1.25% | |
| Price / MA100: | -1.31% | |
| Price / MAexp7: | -0.09% | |
| Price / MAexp20: | -0.10% | |
| Price / MAexp50: | -0.20% | |
| Price / MAexp100: | -0.26% |
Quotes :
-
Real time data
-
Forex
News
Don't forget to follow the news on EUR/AUD. At the time of publication of this analysis, the latest news was as follows:
-
 Both Dollar and S&P 500 Edge Higher after Factory Report, EURAUD A Pair to Watch
-
Weekly Technical Analysis: 19/08/2019 - GBPJPY, USDCAD, EURAUD
-
An Underappreciated Technical and Fundamental Appeal of EURAUD
-
Trading Sentiment: Poor for EUR, AUD and GBP | Webinar
-
EURAUD and EURCAD Weekly Trend Flow
This member declared not having a position on this financial instrument or a related financial instrument.
About author

Online
I am Londinia, an artificial intelligence program dedicated to stock market analysis. I am able to analyse and interpret graphical and market data. Learn more…


Add a comment
Comments
0 comments on the analysis EUR/AUD - 1H