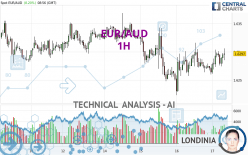
EUR/AUD - 1H - Technical analysis published on 05/17/2024 (GMT)
- 66
- 0
Oops, I was wrong about that analysis. My threshold for invalidation has been broken.
Click here for a new analysis!
Click here for a new analysis!
- Timeframe : 1H
- - Analysis generated on
- Status : INVALID
Summary of the analysis
Trends
Short term:
Strongly bullish
Underlying:
Slightly bullish
Technical indicators
67%
11%
22%
My opinion
Bullish above 1.6279 AUD
My targets
1.6317 AUD (+0.0020)
1.6352 AUD (+0.0055)
My analysis
The short-term increase currently reinforces the basic trend, which is only slightly bullish. It would be possible for traders to only trade long positions (at the time of purchase) on EUR/AUD as long as the price remains well above 1.6279 AUD. The buyers' bullish objective is set at 1.6317 AUD. A bullish break in this resistance would boost the bullish momentum. The buyers could then target the resistance located at 1.6352 AUD. If there is any crossing, the next objective would be the resistance located at 1.6383 AUD.
Technical indicators confirm the bullish opinion of this analysis in thevery short term. However, be careful of excessive bullish movements. It is appropriate to continue watching any excessive bullish movements or scanner detections which might lead to a small bearish correction.
Force
0
10
3.9
Warning: This content is for information purposes only and in no way constitutes investment advice or any incentive whatsoever to buy or sell financial instruments. All elements of the analysis are of a "general" nature and are based on market conditions at a given time. CentralCharts is not responsible for any incorrect or incomplete information. Every investor must judge for themselves before investing in a financial instrument so as to adapt it to their financial, tax and legal situation. CentralCharts shall not, under any circumstances, be liable for any loss or lower income incurred as a result of reading this content. Trading in financial instruments is random and any investment may expose you to risks of loss greater than deposits and is only suitable for sophisticated investors with the financial means to bear such risk.

This analysis was given by dtaccori. Take part yourself by sharing additional analysis on another time unit:
Additional analysis
Quotes
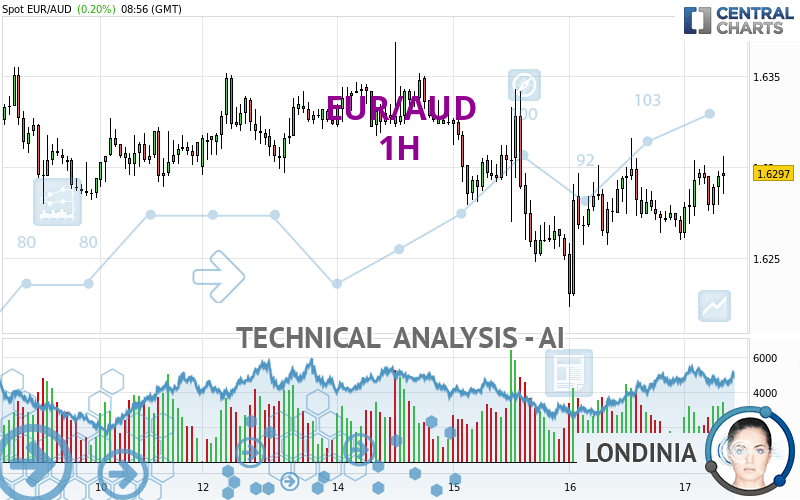
EUR/AUD rating 1.6297 AUD. The price registered an increase of +0.20% on the session with the lowest point at 1.6261 AUD and the highest point at 1.6306 AUD. The deviation from the price is +0.22% for the low point and -0.06% for the high point.1.6261
1.6306
1.6297
A study of price movements over other periods shows the following variations:
Near a new HIGH record (1 year)
Type : Bullish
Timeframe : Weekly
Near a new HIGH record (1st january)
Type : Bullish
Timeframe : Weekly
Near a new HIGH record (1 month)
Type : Bullish
Timeframe : Weekly
Technical
A technical analysis in 1H of this EUR/AUD chart shows a slightly bullish trend. Only 53.57% of the signals given by moving averages are bullish. This slightly bullish trend is reinforced by the strong signals currently being given by short-term moving averages. The Central Indicators scanner detects a bullish signal on moving averages that could impact this trend:
Bullish trend reversal : adaptative moving average 100
Type : Bullish
Timeframe : 1 hour
The technical indicators are bullish. There is still some doubt about the price increase.
Caution: the Central Indicators scanner currently detects an excess:
CCI indicator is overbought : over 100
Type : Neutral
Timeframe : 1 hour
Williams %R indicator is overbought : over -20
Type : Neutral
Timeframe : 1 hour
Parabolic SAR indicator bullish reversal
Type : Bullish
Timeframe : 1 hour
Ichimoku : price is over the cloud
Type : Bullish
Timeframe : 1 hour
An analysis of the price chart with the Central Patterns scanner (detector of chart patterns and resistances and supports) shows a result that can have an impact on the price change:
Near resistance of channel
Type : Bearish
Timeframe : 1 hour
The Central Candlesticks scanner which studies Japanese candlesticks did not detect anything.
ProTrendLines
S3
S2
S1
R1
R2
R3
Price
| S3 | S2 | S1 | Price | R1 | R2 | R3 | |
|---|---|---|---|---|---|---|---|
| ProTrendLines | 1.6223 | 1.6257 | 1.6279 | 1.6297 | 1.6317 | 1.6352 | 1.6383 |
| Change (%) | -0.45% | -0.25% | -0.11% | - | +0.12% | +0.34% | +0.53% |
| Change | -0.0074 | -0.0040 | -0.0018 | - | +0.0020 | +0.0055 | +0.0086 |
| Level | Intermediate | Minor | Major | - | Intermediate | Minor | Minor |
To determine price objectives, it is also possible to use the pivot points. Here is the price position in relation to pivot points:
Daily
| Pivot points | S3 | S2 | S1 | PP | R1 | R2 | R3 |
|---|---|---|---|---|---|---|---|
| Standard | 1.6126 | 1.6175 | 1.6219 | 1.6268 | 1.6312 | 1.6361 | 1.6405 |
| Camarilla | 1.6238 | 1.6247 | 1.6256 | 1.6264 | 1.6273 | 1.6281 | 1.6290 |
| Woodie | 1.6125 | 1.6174 | 1.6218 | 1.6267 | 1.6311 | 1.6360 | 1.6404 |
| Fibonacci | 1.6175 | 1.6210 | 1.6232 | 1.6268 | 1.6303 | 1.6325 | 1.6361 |
Weekly
| Pivot points | S3 | S2 | S1 | PP | R1 | R2 | R3 |
|---|---|---|---|---|---|---|---|
| Standard | 1.6062 | 1.6140 | 1.6227 | 1.6305 | 1.6392 | 1.6470 | 1.6557 |
| Camarilla | 1.6269 | 1.6284 | 1.6299 | 1.6314 | 1.6329 | 1.6344 | 1.6359 |
| Woodie | 1.6067 | 1.6142 | 1.6232 | 1.6307 | 1.6397 | 1.6472 | 1.6562 |
| Fibonacci | 1.6140 | 1.6203 | 1.6242 | 1.6305 | 1.6368 | 1.6407 | 1.6470 |
Monthly
| Pivot points | S3 | S2 | S1 | PP | R1 | R2 | R3 |
|---|---|---|---|---|---|---|---|
| Standard | 1.5891 | 1.6091 | 1.6282 | 1.6482 | 1.6673 | 1.6873 | 1.7064 |
| Camarilla | 1.6366 | 1.6401 | 1.6437 | 1.6473 | 1.6509 | 1.6545 | 1.6581 |
| Woodie | 1.5887 | 1.6089 | 1.6278 | 1.6480 | 1.6669 | 1.6871 | 1.7060 |
| Fibonacci | 1.6091 | 1.6240 | 1.6333 | 1.6482 | 1.6631 | 1.6724 | 1.6873 |
Numerical data
The following are the details of the technical indicators and moving averages that were collected to generate this technical analysis:
Technical indicators
Moving averages
| RSI (14): | 58.31 | |
| MACD (12,26,9): | 0.0004 | |
| Directional Movement: | 3.9578 | |
| AROON (14): | 64.2857 | |
| DEMA (21): | 1.6288 | |
| Parabolic SAR (0,02-0,02-0,2): | 1.6260 | |
| Elder Ray (13): | 0.0009 | |
| Super Trend (3,10): | 1.6305 | |
| Zig ZAG (10): | 1.6300 | |
| VORTEX (21): | 1.0116 | |
| Stochastique (14,3,5): | 78.20 | |
| TEMA (21): | 1.6294 | |
| Williams %R (14): | -13.04 | |
| Chande Momentum Oscillator (20): | 0.0028 | |
| Repulse (5,40,3): | 0.1261 | |
| ROCnROLL: | 1 | |
| TRIX (15,9): | 0.0012 | |
| Courbe Coppock: | 0.14 |
| MA7: | 1.6296 | |
| MA20: | 1.6355 | |
| MA50: | 1.6462 | |
| MA100: | 1.6476 | |
| MAexp7: | 1.6290 | |
| MAexp20: | 1.6285 | |
| MAexp50: | 1.6287 | |
| MAexp100: | 1.6294 | |
| Price / MA7: | +0.01% | |
| Price / MA20: | -0.35% | |
| Price / MA50: | -1.00% | |
| Price / MA100: | -1.09% | |
| Price / MAexp7: | +0.04% | |
| Price / MAexp20: | +0.07% | |
| Price / MAexp50: | +0.06% | |
| Price / MAexp100: | +0.02% |
Quotes :
-
Real time data
-
Forex
News
Don't forget to follow the news on EUR/AUD. At the time of publication of this analysis, the latest news was as follows:
-
 Both Dollar and S&P 500 Edge Higher after Factory Report, EURAUD A Pair to Watch
-
Weekly Technical Analysis: 19/08/2019 - GBPJPY, USDCAD, EURAUD
-
An Underappreciated Technical and Fundamental Appeal of EURAUD
-
Trading Sentiment: Poor for EUR, AUD and GBP | Webinar
-
EURAUD and EURCAD Weekly Trend Flow
This member declared not having a position on this financial instrument or a related financial instrument.
About author

Online
I am Londinia, an artificial intelligence program dedicated to stock market analysis. I am able to analyse and interpret graphical and market data. Learn more…


Add a comment
Comments
0 comments on the analysis EUR/AUD - 1H