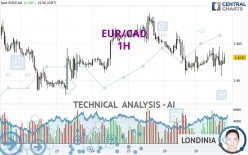
EUR/CAD - 1H - Technical analysis published on 04/29/2024 (GMT)
- 76
- 0
- Timeframe : 1H
- - Analysis generated on
- Status : NEUTRAL

Summary of the analysis

Additional analysis
Quotes
The EUR/CAD rating is 1.4631 CAD. The price registered an increase of +0.08% on the session and was between 1.4606 CAD and 1.4646 CAD. This implies that the price is at +0.17% from its lowest and at -0.10% from its highest.The Central Gaps scanner detects a bullish opening marking the presence of buyers ahead of sellers at the opening but not sufficiently marked to allow the price to register a quotation gap.
Bullish opening
Type : Bullish
Timeframe : Openning
Here is a more detailed summary of the historical variations registered by EUR/CAD:
Near a new LOW record (1 year)
Type : Bearish
Timeframe : Weekly
Near a new HIGH record (1st january)
Type : Bullish
Timeframe : Weekly
Near a new HIGH record (1 month)
Type : Bullish
Timeframe : Weekly
Technical
Technical analysis of EUR/CAD in 1H shows an overall slightly bearish trend. 60.71% of the signals given by moving averages are bearish. As the signals currently given by short-term moving averages are rather neutral, the slightly bearish trend could return to neutral. An assessment of moving averages reveals several bullish signals that could impact this trend:
Bullish price crossover with Moving Average 20
Type : Bullish
Timeframe : 1 hour
Bullish price crossover with adaptative moving average 100
Type : Bullish
Timeframe : 1 hour
An assessment of technical indicators shows a slightly bullish signal.
Caution: the Central Indicators scanner currently detects an excess:
MACD indicator: bullish divergence
Type : Bullish
Timeframe : 1 hour
RSI indicator is back over 50
Type : Bullish
Timeframe : 1 hour
Price is back over the pivot point
Type : Bullish
Timeframe : 1 hour
Momentum indicator is back over 0
Type : Bullish
Timeframe : 1 hour
Williams %R indicator is back over -50
Type : Bullish
Timeframe : 1 hour
The analysis of the price chart with Central Patterns scanners does not return any result.
The Central Candlesticks scanner, specialised in Japanese candlesticks, did not identify any signals.
| S3 | S2 | S1 | Price | R1 | R2 | R3 | |
|---|---|---|---|---|---|---|---|
| ProTrendLines | 1.4580 | 1.4608 | 1.4624 | 1.4631 | 1.4644 | 1.4657 | 1.4691 |
| Change (%) | -0.35% | -0.16% | -0.05% | - | +0.09% | +0.18% | +0.41% |
| Change | -0.0051 | -0.0023 | -0.0007 | - | +0.0013 | +0.0026 | +0.0060 |
| Level | Minor | Intermediate | Major | - | Intermediate | Minor | Intermediate |
Attention could also be paid to pivot points to set price objectives:
| Pivot points | S3 | S2 | S1 | PP | R1 | R2 | R3 |
|---|---|---|---|---|---|---|---|
| Standard | 1.4538 | 1.4573 | 1.4596 | 1.4631 | 1.4654 | 1.4689 | 1.4712 |
| Camarilla | 1.4603 | 1.4608 | 1.4614 | 1.4619 | 1.4624 | 1.4630 | 1.4635 |
| Woodie | 1.4532 | 1.4570 | 1.4590 | 1.4628 | 1.4648 | 1.4686 | 1.4706 |
| Fibonacci | 1.4573 | 1.4595 | 1.4609 | 1.4631 | 1.4653 | 1.4667 | 1.4689 |
| Pivot points | S3 | S2 | S1 | PP | R1 | R2 | R3 |
|---|---|---|---|---|---|---|---|
| Standard | 1.4458 | 1.4519 | 1.4569 | 1.4630 | 1.4680 | 1.4741 | 1.4791 |
| Camarilla | 1.4589 | 1.4599 | 1.4609 | 1.4619 | 1.4629 | 1.4639 | 1.4650 |
| Woodie | 1.4453 | 1.4516 | 1.4564 | 1.4627 | 1.4675 | 1.4738 | 1.4786 |
| Fibonacci | 1.4519 | 1.4561 | 1.4588 | 1.4630 | 1.4672 | 1.4699 | 1.4741 |
| Pivot points | S3 | S2 | S1 | PP | R1 | R2 | R3 |
|---|---|---|---|---|---|---|---|
| Standard | 1.4345 | 1.4465 | 1.4540 | 1.4660 | 1.4735 | 1.4855 | 1.4930 |
| Camarilla | 1.4561 | 1.4579 | 1.4597 | 1.4615 | 1.4633 | 1.4651 | 1.4669 |
| Woodie | 1.4323 | 1.4454 | 1.4518 | 1.4649 | 1.4713 | 1.4844 | 1.4908 |
| Fibonacci | 1.4465 | 1.4540 | 1.4586 | 1.4660 | 1.4735 | 1.4781 | 1.4855 |
Numerical data
The following are the details of the technical indicators and moving averages that were collected to generate this technical analysis:
| RSI (14): | 49.89 | |
| MACD (12,26,9): | -0.0002 | |
| Directional Movement: | -4.7996 | |
| AROON (14): | -7.1429 | |
| DEMA (21): | 1.4625 | |
| Parabolic SAR (0,02-0,02-0,2): | 1.4645 | |
| Elder Ray (13): | 0.0003 | |
| Super Trend (3,10): | 1.4657 | |
| Zig ZAG (10): | 1.4632 | |
| VORTEX (21): | 1.0000 | |
| Stochastique (14,3,5): | 52.50 | |
| TEMA (21): | 1.4627 | |
| Williams %R (14): | -35.00 | |
| Chande Momentum Oscillator (20): | 0.0005 | |
| Repulse (5,40,3): | -0.0011 | |
| ROCnROLL: | -1 | |
| TRIX (15,9): | -0.0026 | |
| Courbe Coppock: | 0.05 |
| MA7: | 1.4634 | |
| MA20: | 1.4665 | |
| MA50: | 1.4681 | |
| MA100: | 1.4643 | |
| MAexp7: | 1.4628 | |
| MAexp20: | 1.4628 | |
| MAexp50: | 1.4633 | |
| MAexp100: | 1.4637 | |
| Price / MA7: | -0.02% | |
| Price / MA20: | -0.23% | |
| Price / MA50: | -0.34% | |
| Price / MA100: | -0.08% | |
| Price / MAexp7: | +0.02% | |
| Price / MAexp20: | +0.02% | |
| Price / MAexp50: | -0.01% | |
| Price / MAexp100: | -0.04% |
News
Don't forget to follow the news on EUR/CAD. At the time of publication of this analysis, the latest news was as follows:
-
 Forex Analysis: EUR/USD, GBP/USD, EUR/CAD - Amana Capital
-
Why I'm looking to sell EURCAD: Coleman
-
EUR/CAD To Hold Steady
-
EUR/CAD Bullish Breakthrough
-
Bullish Divergence – EURCAD
About author

Online


Add a comment
Comments
0 comments on the analysis EUR/CAD - 1H