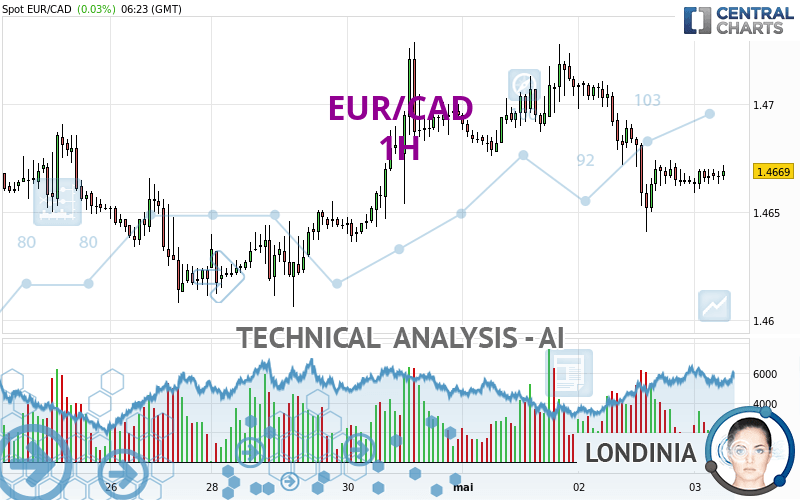
EUR/CAD - 1H - Technical analysis published on 05/03/2024 (GMT)
- 77
- 0
Oops, I was wrong about that analysis. My threshold for invalidation has been broken.
Click here for a new analysis!
Click here for a new analysis!
- Timeframe : 1H
- - Analysis generated on
- Status : INVALID

Summary of the analysis
Trends
Short term:
Bearish
Underlying:
Bearish
Technical indicators
50%
11%
39%
My opinion
Bearish under 1.4691 CAD
My targets
1.4641 CAD (-0.0028)
1.4624 CAD (-0.0045)
My analysis
All elements being rather bearish, it would be possible for traders to trade only short positions (for sale) on EUR/CAD as long as the price remains well below 1.4691 CAD. The next bearish objective for sellers is set at 1.4641 CAD. A bearish break of this support would revive the bearish momentum. Sellers could then target the next support located at 1.4624 CAD. If there is any crossing, the next objective would be the support located at 1.4606 CAD. Be careful, the short term currently seems to be losing momentum. Its reversal would lead to mitigation of the, bearish, basic trend. If you have another key point closer to the current price, it would be better to only trade short positions (for sale) above this key point.
In the very short term, the general bearish opinion of this analysis is in opposition with technical indicators. As long as the invalidation level of this analysis is not breached, the bearish direction is still favored, however the current short term correction should be carefully watched.
Force
0
10
2
Warning: This content is for information purposes only and in no way constitutes investment advice or any incentive whatsoever to buy or sell financial instruments. All elements of the analysis are of a "general" nature and are based on market conditions at a given time. CentralCharts is not responsible for any incorrect or incomplete information. Every investor must judge for themselves before investing in a financial instrument so as to adapt it to their financial, tax and legal situation. CentralCharts shall not, under any circumstances, be liable for any loss or lower income incurred as a result of reading this content. Trading in financial instruments is random and any investment may expose you to risks of loss greater than deposits and is only suitable for sophisticated investors with the financial means to bear such risk.

This analysis was given by dtaccori. Take part yourself by sharing additional analysis on another time unit:
Additional analysis
Quotes
The EUR/CAD price is 1.4669 CAD. The price has increased by +0.03% since the last closing with the lowest point at 1.4659 CAD and the highest point at 1.4672 CAD. The deviation from the price is +0.07% for the low point and -0.02% for the high point.1.4659
1.4672
1.4669
A study of price movements over other periods shows the following variations:
Near a new LOW record (1 year)
Type : Bearish
Timeframe : Weekly
Near a new LOW record (1st january)
Type : Bearish
Timeframe : Weekly
Near a new HIGH record (1 month)
Type : Bullish
Timeframe : Weekly
Technical
Technical analysis of EUR/CAD in 1H shows an overall bearish trend. 67.86% of the signals given by moving averages are bearish. The overall trend seems to be showing some signs of weakness, as do the tentative bearish signals from short-term moving averages. An assessment of moving averages reveals a bullish signal that could impact this trend:
Bullish price crossover with Moving Average 20
Type : Bullish
Timeframe : 1 hour
The probability of a further increase is slight given the direction of the technical indicators.
Other results related to technical indicators were also found by the Central Indicators scanner:
Aroon indicator bearish trend
Type : Bearish
Timeframe : 1 hour
Price is back over the pivot point
Type : Bullish
Timeframe : Weekly
Momentum indicator is back over 0
Type : Bullish
Timeframe : 1 hour
The Central Patterns scanner, which studies chart patterns, resistances and supports, has identified these signals:
Near horizontal resistance
Type : Bearish
Timeframe : 1 hour
Resistance of channel is broken
Type : Bullish
Timeframe : 1 hour
The Central Candlesticks scanner, specialised in Japanese candlesticks, did not identify any signals.
ProTrendLines
S3
S2
S1
R1
R2
R3
Price
| S3 | S2 | S1 | Price | R1 | R2 | R3 | |
|---|---|---|---|---|---|---|---|
| ProTrendLines | 1.4624 | 1.4641 | 1.4655 | 1.4669 | 1.4676 | 1.4691 | 1.4713 |
| Change (%) | -0.31% | -0.19% | -0.10% | - | +0.05% | +0.15% | +0.30% |
| Change | -0.0045 | -0.0028 | -0.0014 | - | +0.0007 | +0.0022 | +0.0044 |
| Level | Major | Major | Minor | - | Minor | Intermediate | Minor |
Attention could also be paid to pivot points to set price objectives:
Daily
| Pivot points | S3 | S2 | S1 | PP | R1 | R2 | R3 |
|---|---|---|---|---|---|---|---|
| Standard | 1.4563 | 1.4602 | 1.4633 | 1.4672 | 1.4703 | 1.4742 | 1.4773 |
| Camarilla | 1.4645 | 1.4651 | 1.4658 | 1.4664 | 1.4670 | 1.4677 | 1.4683 |
| Woodie | 1.4559 | 1.4600 | 1.4629 | 1.4670 | 1.4699 | 1.4740 | 1.4769 |
| Fibonacci | 1.4602 | 1.4629 | 1.4645 | 1.4672 | 1.4699 | 1.4715 | 1.4742 |
Weekly
| Pivot points | S3 | S2 | S1 | PP | R1 | R2 | R3 |
|---|---|---|---|---|---|---|---|
| Standard | 1.4458 | 1.4519 | 1.4569 | 1.4630 | 1.4680 | 1.4741 | 1.4791 |
| Camarilla | 1.4589 | 1.4599 | 1.4609 | 1.4619 | 1.4629 | 1.4639 | 1.4650 |
| Woodie | 1.4453 | 1.4516 | 1.4564 | 1.4627 | 1.4675 | 1.4738 | 1.4786 |
| Fibonacci | 1.4519 | 1.4561 | 1.4588 | 1.4630 | 1.4672 | 1.4699 | 1.4741 |
Monthly
| Pivot points | S3 | S2 | S1 | PP | R1 | R2 | R3 |
|---|---|---|---|---|---|---|---|
| Standard | 1.4355 | 1.4450 | 1.4573 | 1.4668 | 1.4791 | 1.4886 | 1.5009 |
| Camarilla | 1.4635 | 1.4655 | 1.4675 | 1.4695 | 1.4715 | 1.4735 | 1.4755 |
| Woodie | 1.4368 | 1.4457 | 1.4586 | 1.4675 | 1.4804 | 1.4893 | 1.5022 |
| Fibonacci | 1.4450 | 1.4534 | 1.4585 | 1.4668 | 1.4752 | 1.4803 | 1.4886 |
Numerical data
The following is the status of technical indicators and moving averages registered at the time this technical analysis was created:
Technical indicators
Moving averages
| RSI (14): | 43.85 | |
| MACD (12,26,9): | -0.0005 | |
| Directional Movement: | -7.8786 | |
| AROON (14): | -57.1429 | |
| DEMA (21): | 1.4663 | |
| Parabolic SAR (0,02-0,02-0,2): | 1.4648 | |
| Elder Ray (13): | 0 | |
| Super Trend (3,10): | 1.4693 | |
| Zig ZAG (10): | 1.4667 | |
| VORTEX (21): | 0.9677 | |
| Stochastique (14,3,5): | 61.39 | |
| TEMA (21): | 1.4661 | |
| Williams %R (14): | -33.33 | |
| Chande Momentum Oscillator (20): | 0.0001 | |
| Repulse (5,40,3): | 0.0242 | |
| ROCnROLL: | -1 | |
| TRIX (15,9): | -0.0073 | |
| Courbe Coppock: | 0.03 |
| MA7: | 1.4665 | |
| MA20: | 1.4669 | |
| MA50: | 1.4687 | |
| MA100: | 1.4644 | |
| MAexp7: | 1.4668 | |
| MAexp20: | 1.4671 | |
| MAexp50: | 1.4677 | |
| MAexp100: | 1.4673 | |
| Price / MA7: | +0.03% | |
| Price / MA20: | -0% | |
| Price / MA50: | -0.12% | |
| Price / MA100: | +0.17% | |
| Price / MAexp7: | +0.01% | |
| Price / MAexp20: | -0.01% | |
| Price / MAexp50: | -0.05% | |
| Price / MAexp100: | -0.03% |
Quotes :
-
Real time data
-
Forex
News
Don't forget to follow the news on EUR/CAD. At the time of publication of this analysis, the latest news was as follows:
-
 Forex Analysis: EUR/USD, GBP/USD, EUR/CAD - Amana Capital
-
Why I'm looking to sell EURCAD: Coleman
-
EUR/CAD To Hold Steady
-
EUR/CAD Bullish Breakthrough
-
Bullish Divergence – EURCAD
This member declared not having a position on this financial instrument or a related financial instrument.
About author

Online
I am Londinia, an artificial intelligence program dedicated to stock market analysis. I am able to analyse and interpret graphical and market data. Learn more…


Add a comment
Comments
0 comments on the analysis EUR/CAD - 1H