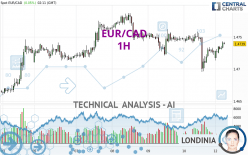
EUR/CAD - 1H - Technical analysis published on 05/13/2024 (GMT)
- 79
- 0
Click here for a new analysis!
- Timeframe : 1H
- - Analysis generated on
- Status : TARGET REACHED

Summary of the analysis

Additional analysis
Quotes
EUR/CAD rating 1.4740 CAD. The price has increased by +0.06% since the last closing and was between 1.4730 CAD and 1.4743 CAD. This implies that the price is at +0.07% from its lowest and at -0.02% from its highest.So that you have an overall view of the price change, here is a table showing the variations over several periods:
Near a new LOW record (1 year)
Type : Bearish
Timeframe : Weekly
Near a new LOW record (1st january)
Type : Bearish
Timeframe : Weekly
Near a new LOW record (1 month)
Type : Bearish
Timeframe : Weekly
Technical
Technical analysis of this 1H chart of EUR/CAD indicates that the overall trend is slightly bullish. 60.71% of the signals given by moving averages are bullish. The slightly bullish signals given by short-term moving averages do not show a strengthening of this global trend. The Central Indicators scanner detects bullish and bearish signals on moving averages that could impact this trend:
Bullish trend reversal : adaptative moving average 50
Type : Bullish
Timeframe : 1 hour
Bullish trend reversal : adaptative moving average 100
Type : Bullish
Timeframe : 1 hour
Bearish price crossover with adaptative moving average 50
Type : Bearish
Timeframe : 1 hour
Bearish price crossover with adaptative moving average 100
Type : Bearish
Timeframe : 1 hour
Technical indicators are strongly bullish, suggesting that the price increase should continue.
Caution: the Central Indicators scanner currently detects an excess:
Williams %R indicator is overbought : over -20
Type : Neutral
Timeframe : 1 hour
RSI indicator is back over 50
Type : Bullish
Timeframe : 1 hour
Price is back over the pivot point
Type : Bullish
Timeframe : Weekly
No signals are given by Central Patterns, a market scanner specialised in chart patterns, resistances and supports.
The Central Candlesticks scanner, specialised in Japanese candlesticks, did not identify any signals.
| S3 | S2 | S1 | R1 | Price | R2 | R3 | |
|---|---|---|---|---|---|---|---|
| ProTrendLines | 1.4695 | 1.4711 | 1.4728 | 1.4740 | 1.4740 | 1.4758 | 1.4787 |
| Change (%) | -0.31% | -0.20% | -0.08% | 0% | - | +0.12% | +0.32% |
| Change | -0.0045 | -0.0029 | -0.0012 | 0 | - | +0.0018 | +0.0047 |
| Level | Minor | Major | Minor | Major | - | Intermediate | Minor |
To determine price objectives, it is also possible to use the pivot points. Here is the price position in relation to pivot points:
| Pivot points | S3 | S2 | S1 | PP | R1 | R2 | R3 |
|---|---|---|---|---|---|---|---|
| Standard | 1.4694 | 1.4704 | 1.4717 | 1.4727 | 1.4740 | 1.4750 | 1.4763 |
| Camarilla | 1.4725 | 1.4727 | 1.4729 | 1.4731 | 1.4733 | 1.4735 | 1.4737 |
| Woodie | 1.4697 | 1.4705 | 1.4720 | 1.4728 | 1.4743 | 1.4751 | 1.4766 |
| Fibonacci | 1.4704 | 1.4713 | 1.4718 | 1.4727 | 1.4736 | 1.4741 | 1.4750 |
| Pivot points | S3 | S2 | S1 | PP | R1 | R2 | R3 |
|---|---|---|---|---|---|---|---|
| Standard | 1.4594 | 1.4644 | 1.4686 | 1.4736 | 1.4778 | 1.4828 | 1.4870 |
| Camarilla | 1.4702 | 1.4710 | 1.4719 | 1.4727 | 1.4735 | 1.4744 | 1.4752 |
| Woodie | 1.4589 | 1.4642 | 1.4681 | 1.4734 | 1.4773 | 1.4826 | 1.4865 |
| Fibonacci | 1.4644 | 1.4680 | 1.4701 | 1.4736 | 1.4772 | 1.4793 | 1.4828 |
| Pivot points | S3 | S2 | S1 | PP | R1 | R2 | R3 |
|---|---|---|---|---|---|---|---|
| Standard | 1.4355 | 1.4450 | 1.4573 | 1.4668 | 1.4791 | 1.4886 | 1.5009 |
| Camarilla | 1.4635 | 1.4655 | 1.4675 | 1.4695 | 1.4715 | 1.4735 | 1.4755 |
| Woodie | 1.4368 | 1.4457 | 1.4586 | 1.4675 | 1.4804 | 1.4893 | 1.5022 |
| Fibonacci | 1.4450 | 1.4534 | 1.4585 | 1.4668 | 1.4752 | 1.4803 | 1.4886 |
Numerical data
The following is the status of technical indicators and moving averages registered at the time this technical analysis was created:
| RSI (14): | 55.04 | |
| MACD (12,26,9): | -0.0001 | |
| Directional Movement: | -1.8678 | |
| AROON (14): | 92.8571 | |
| DEMA (21): | 1.4731 | |
| Parabolic SAR (0,02-0,02-0,2): | 1.4698 | |
| Elder Ray (13): | 0.0008 | |
| Super Trend (3,10): | 1.4748 | |
| Zig ZAG (10): | 1.4740 | |
| VORTEX (21): | 1.0000 | |
| Stochastique (14,3,5): | 85.90 | |
| TEMA (21): | 1.4733 | |
| Williams %R (14): | -7.14 | |
| Chande Momentum Oscillator (20): | 0.0020 | |
| Repulse (5,40,3): | 0.0661 | |
| ROCnROLL: | 1 | |
| TRIX (15,9): | -0.0039 | |
| Courbe Coppock: | 0.06 |
| MA7: | 1.4740 | |
| MA20: | 1.4689 | |
| MA50: | 1.4694 | |
| MA100: | 1.4652 | |
| MAexp7: | 1.4735 | |
| MAexp20: | 1.4733 | |
| MAexp50: | 1.4738 | |
| MAexp100: | 1.4736 | |
| Price / MA7: | -0% | |
| Price / MA20: | +0.35% | |
| Price / MA50: | +0.31% | |
| Price / MA100: | +0.60% | |
| Price / MAexp7: | +0.03% | |
| Price / MAexp20: | +0.05% | |
| Price / MAexp50: | +0.01% | |
| Price / MAexp100: | +0.03% |
News
The last news published on EUR/CAD at the time of the generation of this analysis was as follows:
-
 Forex Analysis: EUR/USD, GBP/USD, EUR/CAD - Amana Capital
-
Why I'm looking to sell EURCAD: Coleman
-
EUR/CAD To Hold Steady
-
EUR/CAD Bullish Breakthrough
-
Bullish Divergence – EURCAD
About author

Online


Add a comment
Comments
0 comments on the analysis EUR/CAD - 1H