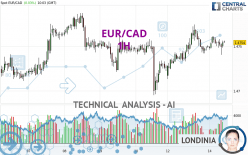
EUR/CAD - 1H - Technical analysis published on 05/14/2024 (GMT)
- 56
- 0
Click here for a new analysis!
- Timeframe : 1H
- - Analysis generated on
- Status : TARGET REACHED

Summary of the analysis

Additional analysis
Quotes
The EUR/CAD price is 1.4754 CAD. The price has increased by +0.03% since the last closing and was between 1.4740 CAD and 1.4761 CAD. This implies that the price is at +0.09% from its lowest and at -0.05% from its highest.So that you have an overall view of the price change, here is a table showing the variations over several periods:
Near a new LOW record (1 year)
Type : Bearish
Timeframe : Weekly
Near a new LOW record (1st january)
Type : Bearish
Timeframe : Weekly
Near a new LOW record (1 month)
Type : Bearish
Timeframe : Weekly
Technical
Technical analysis of this 1H chart of EUR/CAD indicates that the overall trend is bullish. 75.00% of the signals given by moving averages are bullish. This bullish trend shows slight signs of slowing down given the slightly bullish signals given by the short-term moving averages. The Central Indicators scanner detects bullish signals on moving averages that could impact this trend:
Bullish price crossover with Moving Average 20
Type : Bullish
Timeframe : 1 hour
Bullish price crossover with adaptative moving average 20
Type : Bullish
Timeframe : 1 hour
In fact, according to the parameters integrated into the Central Analyzer system, only 8 technical indicators out of 18 analysed are currently bullish. Central Indicators, the detector scanner for these technical indicators has recently detected several signals:
RSI indicator is back over 50
Type : Bullish
Timeframe : 1 hour
Price is back over the pivot point
Type : Bullish
Timeframe : 1 hour
Price is back over the pivot point
Type : Bullish
Timeframe : Weekly
Williams %R indicator is back over -50
Type : Bullish
Timeframe : 1 hour
An analysis of the price chart with the Central Patterns scanner (detector of chart patterns and resistances and supports) shows a result that can have an impact on the price change:
Near support of channel
Type : Bullish
Timeframe : 1 hour
Central Candlesticks, the scanner specialised in Japanese candlesticks, detects this inversion signal that could impact the current short-term trend:
Doji
Type : Neutral
Timeframe : 1 hour
| S3 | S2 | S1 | Price | R1 | R2 | R3 | |
|---|---|---|---|---|---|---|---|
| ProTrendLines | 1.4663 | 1.4711 | 1.4740 | 1.4754 | 1.4758 | 1.4774 | 1.4787 |
| Change (%) | -0.62% | -0.29% | -0.09% | - | +0.03% | +0.14% | +0.22% |
| Change | -0.0091 | -0.0043 | -0.0014 | - | +0.0004 | +0.0020 | +0.0033 |
| Level | Minor | Major | Major | - | Minor | Intermediate | Minor |
Pivot points can also be used to set your price objectives. Here is the price situation in relation to pivot points:
| Pivot points | S3 | S2 | S1 | PP | R1 | R2 | R3 |
|---|---|---|---|---|---|---|---|
| Standard | 1.4656 | 1.4684 | 1.4717 | 1.4745 | 1.4778 | 1.4806 | 1.4839 |
| Camarilla | 1.4732 | 1.4738 | 1.4743 | 1.4749 | 1.4755 | 1.4760 | 1.4766 |
| Woodie | 1.4658 | 1.4685 | 1.4719 | 1.4746 | 1.4780 | 1.4807 | 1.4841 |
| Fibonacci | 1.4684 | 1.4708 | 1.4722 | 1.4745 | 1.4769 | 1.4783 | 1.4806 |
| Pivot points | S3 | S2 | S1 | PP | R1 | R2 | R3 |
|---|---|---|---|---|---|---|---|
| Standard | 1.4594 | 1.4644 | 1.4686 | 1.4736 | 1.4778 | 1.4828 | 1.4870 |
| Camarilla | 1.4702 | 1.4710 | 1.4719 | 1.4727 | 1.4735 | 1.4744 | 1.4752 |
| Woodie | 1.4589 | 1.4642 | 1.4681 | 1.4734 | 1.4773 | 1.4826 | 1.4865 |
| Fibonacci | 1.4644 | 1.4680 | 1.4701 | 1.4736 | 1.4772 | 1.4793 | 1.4828 |
| Pivot points | S3 | S2 | S1 | PP | R1 | R2 | R3 |
|---|---|---|---|---|---|---|---|
| Standard | 1.4355 | 1.4450 | 1.4573 | 1.4668 | 1.4791 | 1.4886 | 1.5009 |
| Camarilla | 1.4635 | 1.4655 | 1.4675 | 1.4695 | 1.4715 | 1.4735 | 1.4755 |
| Woodie | 1.4368 | 1.4457 | 1.4586 | 1.4675 | 1.4804 | 1.4893 | 1.5022 |
| Fibonacci | 1.4450 | 1.4534 | 1.4585 | 1.4668 | 1.4752 | 1.4803 | 1.4886 |
Numerical data
The following is the status of the technical indicators and moving averages at the time of publication of this technical analysis:
| RSI (14): | 53.88 | |
| MACD (12,26,9): | 0.0002 | |
| Directional Movement: | -2.4482 | |
| AROON (14): | -42.8571 | |
| DEMA (21): | 1.4755 | |
| Parabolic SAR (0,02-0,02-0,2): | 1.4761 | |
| Elder Ray (13): | -0.0001 | |
| Super Trend (3,10): | 1.4734 | |
| Zig ZAG (10): | 1.4755 | |
| VORTEX (21): | 0.9827 | |
| Stochastique (14,3,5): | 55.64 | |
| TEMA (21): | 1.4754 | |
| Williams %R (14): | -28.57 | |
| Chande Momentum Oscillator (20): | 0.0007 | |
| Repulse (5,40,3): | 0.0528 | |
| ROCnROLL: | 1 | |
| TRIX (15,9): | 0.0029 | |
| Courbe Coppock: | 0.00 |
| MA7: | 1.4745 | |
| MA20: | 1.4690 | |
| MA50: | 1.4695 | |
| MA100: | 1.4653 | |
| MAexp7: | 1.4753 | |
| MAexp20: | 1.4751 | |
| MAexp50: | 1.4748 | |
| MAexp100: | 1.4744 | |
| Price / MA7: | +0.06% | |
| Price / MA20: | +0.44% | |
| Price / MA50: | +0.40% | |
| Price / MA100: | +0.69% | |
| Price / MAexp7: | +0.01% | |
| Price / MAexp20: | +0.02% | |
| Price / MAexp50: | +0.04% | |
| Price / MAexp100: | +0.07% |
News
Don't forget to follow the news on EUR/CAD. At the time of publication of this analysis, the latest news was as follows:
-
 Forex Analysis: EUR/USD, GBP/USD, EUR/CAD - Amana Capital
-
Why I'm looking to sell EURCAD: Coleman
-
EUR/CAD To Hold Steady
-
EUR/CAD Bullish Breakthrough
-
Bullish Divergence – EURCAD
About author

Online


Add a comment
Comments
0 comments on the analysis EUR/CAD - 1H