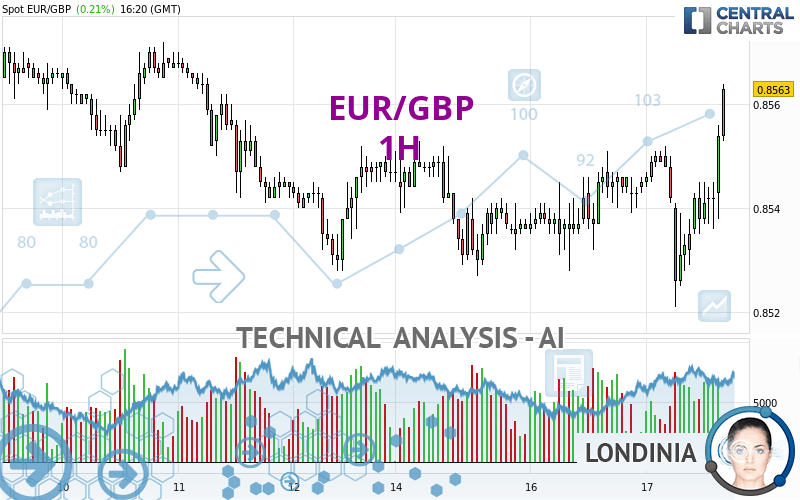
EUR/GBP - 1H - Technical analysis published on 04/17/2024 (GMT)
- 77
- 0
Click here for a new analysis!
- Timeframe : 1H
- - Analysis generated on
- Status : TARGET REACHED

Summary of the analysis

Additional analysis
Quotes
EUR/GBP rating 0.8563 GBP. The price registered an increase of +0.21% on the session and was between 0.8521 GBP and 0.8564 GBP. This implies that the price is at +0.49% from its lowest and at -0.01% from its highest.Here is a more detailed summary of the historical variations registered by EUR/GBP:
Near a new LOW record (5 years)
Type : Bearish
Timeframe : Weekly
Near a new HIGH record (1 year)
Type : Bullish
Timeframe : Weekly
Near a new HIGH record (1st january)
Type : Bullish
Timeframe : Weekly
Near a new HIGH record (1 month)
Type : Bullish
Timeframe : Weekly
New LOW record (1 month)
Type : Bearish
Timeframe : Weekly
Technical
A technical analysis in 1H of this EUR/GBP chart shows a strongly bullish trend. The signals given by the moving averages are 82.14% bullish. This strong bullish trend is confirmed by the strong signals currently being given by short-term moving averages. The Central Indicators market scanner is currently detecting several bullish signals that could impact this trend:
Bullish trend reversal : Moving Average 20
Type : Bullish
Timeframe : 1 hour
Bullish trend reversal : Moving Average 100
Type : Bullish
Timeframe : 1 hour
Bullish trend reversal : adaptative moving average 100
Type : Bullish
Timeframe : 1 hour
In fact, 16 technical indicators on 18 studied are currently positioned bullish. Caution: the Central Indicators scanner currently detects an excess:
CCI indicator is overbought : over 100
Type : Neutral
Timeframe : 1 hour
Williams %R indicator is overbought : over -20
Type : Neutral
Timeframe : 1 hour
Pivot points : price is over resistance 1
Type : Neutral
Timeframe : 1 hour
Price is back over the pivot point
Type : Bullish
Timeframe : Weekly
An analysis of the price chart with the Central Patterns scanner (detector of chart patterns and resistances and supports) shows several results that can have an impact on the price change:
Near horizontal resistance
Type : Bearish
Timeframe : 1 hour
Resistance of channel is broken
Type : Bullish
Timeframe : 1 hour
The Central Candlesticks scanner, specialised in Japanese candlesticks, did not identify any signals.
| S3 | S2 | S1 | Price | R1 | R2 | R3 | |
|---|---|---|---|---|---|---|---|
| ProTrendLines | 0.8542 | 0.8551 | 0.8561 | 0.8563 | 0.8572 | 0.8579 | 0.8588 |
| Change (%) | -0.25% | -0.14% | -0.02% | - | +0.11% | +0.19% | +0.29% |
| Change | -0.0021 | -0.0012 | -0.0002 | - | +0.0009 | +0.0016 | +0.0025 |
| Level | Minor | Intermediate | Minor | - | Intermediate | Intermediate | Intermediate |
Attention could also be paid to pivot points to set price objectives:
| Pivot points | S3 | S2 | S1 | PP | R1 | R2 | R3 |
|---|---|---|---|---|---|---|---|
| Standard | 0.8509 | 0.8518 | 0.8532 | 0.8541 | 0.8555 | 0.8564 | 0.8578 |
| Camarilla | 0.8539 | 0.8541 | 0.8543 | 0.8545 | 0.8547 | 0.8549 | 0.8551 |
| Woodie | 0.8511 | 0.8519 | 0.8534 | 0.8542 | 0.8557 | 0.8565 | 0.8580 |
| Fibonacci | 0.8518 | 0.8527 | 0.8533 | 0.8541 | 0.8550 | 0.8556 | 0.8564 |
| Pivot points | S3 | S2 | S1 | PP | R1 | R2 | R3 |
|---|---|---|---|---|---|---|---|
| Standard | 0.8461 | 0.8494 | 0.8521 | 0.8554 | 0.8581 | 0.8614 | 0.8641 |
| Camarilla | 0.8531 | 0.8536 | 0.8542 | 0.8547 | 0.8553 | 0.8558 | 0.8564 |
| Woodie | 0.8457 | 0.8493 | 0.8517 | 0.8553 | 0.8577 | 0.8613 | 0.8637 |
| Fibonacci | 0.8494 | 0.8517 | 0.8531 | 0.8554 | 0.8577 | 0.8591 | 0.8614 |
| Pivot points | S3 | S2 | S1 | PP | R1 | R2 | R3 |
|---|---|---|---|---|---|---|---|
| Standard | 0.8395 | 0.8449 | 0.8495 | 0.8549 | 0.8595 | 0.8649 | 0.8695 |
| Camarilla | 0.8514 | 0.8523 | 0.8532 | 0.8541 | 0.8550 | 0.8559 | 0.8569 |
| Woodie | 0.8391 | 0.8447 | 0.8491 | 0.8547 | 0.8591 | 0.8647 | 0.8691 |
| Fibonacci | 0.8449 | 0.8487 | 0.8511 | 0.8549 | 0.8587 | 0.8611 | 0.8649 |
Numerical data
The following is the status of technical indicators and moving averages registered at the time this technical analysis was created:
| RSI (14): | 66.05 | |
| MACD (12,26,9): | 0.0002 | |
| Directional Movement: | 10.2705 | |
| AROON (14): | 71.4286 | |
| DEMA (21): | 0.8546 | |
| Parabolic SAR (0,02-0,02-0,2): | 0.8522 | |
| Elder Ray (13): | 0.0013 | |
| Super Trend (3,10): | 0.8531 | |
| Zig ZAG (10): | 0.8561 | |
| VORTEX (21): | 1.0552 | |
| Stochastique (14,3,5): | 84.90 | |
| TEMA (21): | 0.8548 | |
| Williams %R (14): | -4.88 | |
| Chande Momentum Oscillator (20): | 0.0013 | |
| Repulse (5,40,3): | 0.2611 | |
| ROCnROLL: | 1 | |
| TRIX (15,9): | 0.0003 | |
| Courbe Coppock: | 0.01 |
| MA7: | 0.8552 | |
| MA20: | 0.8562 | |
| MA50: | 0.8552 | |
| MA100: | 0.8574 | |
| MAexp7: | 0.8548 | |
| MAexp20: | 0.8543 | |
| MAexp50: | 0.8542 | |
| MAexp100: | 0.8545 | |
| Price / MA7: | +0.13% | |
| Price / MA20: | +0.01% | |
| Price / MA50: | +0.13% | |
| Price / MA100: | -0.13% | |
| Price / MAexp7: | +0.18% | |
| Price / MAexp20: | +0.23% | |
| Price / MAexp50: | +0.25% | |
| Price / MAexp100: | +0.21% |
News
The last news published on EUR/GBP at the time of the generation of this analysis was as follows:
-
 Weekly Technical Outlook: 08/04/2024 - USDJPY, EURGBP, USDCAD
-
EUR/GBP Forecast April 2, 2024
-
EUR/GBP Forecast March 29, 2024
-
Technical Analysis: 13/03/2024 - EURGBP starts to take a bullish shape
-
Technical Analysis: 20/12/2023 - Could EURGBP bulls keep the rebound alive?
About author

Online


Add a comment
Comments
0 comments on the analysis EUR/GBP - 1H