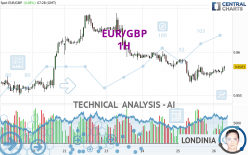
EUR/GBP - 1H - Technical analysis published on 04/26/2024 (GMT)
- 74
- 0
Click here for a new analysis!
- Timeframe : 1H
- - Analysis generated on
- Status : TARGET REACHED

Summary of the analysis

Additional analysis
Quotes
The EUR/GBP rating is 0.8583 GBP. The price has increased by +0.08% since the last closing with the lowest point at 0.8574 GBP and the highest point at 0.8584 GBP. The deviation from the price is +0.10% for the low point and -0.01% for the high point.So that you have an overall view of the price change, here is a table showing the variations over several periods:
Near a new LOW record (5 years)
Type : Bearish
Timeframe : Weekly
Near a new HIGH record (1 year)
Type : Bullish
Timeframe : Weekly
Near a new HIGH record (1st january)
Type : Bullish
Timeframe : Weekly
Near a new HIGH record (1 month)
Type : Bullish
Timeframe : Weekly
Technical
A technical analysis in 1H of this EUR/GBP chart shows a bearish trend. The signals given by moving averages are 64.29% bearish. This bearish trend could slow down given the neutral signals currently being given by short-term moving averages. The Central Indicators market scanner is currently detecting several bullish signals that could impact this trend:
Bullish trend reversal : adaptative moving average 20
Type : Bullish
Timeframe : 1 hour
Bullish price crossover with Moving Average 50
Type : Bullish
Timeframe : 1 hour
In fact, according to the parameters integrated into the Central Analyzer system, 13 technical indicators out of 18 analysed are currently bullish. Caution: the Central Indicators scanner currently detects an excess:
CCI indicator is overbought : over 100
Type : Neutral
Timeframe : 1 hour
Williams %R indicator is overbought : over -20
Type : Neutral
Timeframe : 1 hour
Aroon indicator bullish trend
Type : Bullish
Timeframe : 1 hour
Central Patterns, the market scanner focusing on chart patterns, resistances and supports found this result:
Near resistance of channel
Type : Bearish
Timeframe : 1 hour
Central Candlesticks, the scanner specialised in Japanese candlesticks, detects this inversion signal that could impact the current short-term trend:
Doji
Type : Neutral
Timeframe : 1 hour
| S3 | S2 | S1 | Price | R1 | R2 | R3 | |
|---|---|---|---|---|---|---|---|
| ProTrendLines | 0.8536 | 0.8551 | 0.8580 | 0.8583 | 0.8601 | 0.8626 | 0.8645 |
| Change (%) | -0.55% | -0.37% | -0.03% | - | +0.21% | +0.50% | +0.72% |
| Change | -0.0047 | -0.0032 | -0.0003 | - | +0.0018 | +0.0043 | +0.0062 |
| Level | Intermediate | Intermediate | Major | - | Intermediate | Intermediate | Intermediate |
To determine price objectives, it is also possible to use the pivot points. Here is the price position in relation to pivot points:
| Pivot points | S3 | S2 | S1 | PP | R1 | R2 | R3 |
|---|---|---|---|---|---|---|---|
| Standard | 0.8535 | 0.8549 | 0.8563 | 0.8577 | 0.8591 | 0.8605 | 0.8619 |
| Camarilla | 0.8568 | 0.8571 | 0.8573 | 0.8576 | 0.8579 | 0.8581 | 0.8584 |
| Woodie | 0.8534 | 0.8549 | 0.8562 | 0.8577 | 0.8590 | 0.8605 | 0.8618 |
| Fibonacci | 0.8549 | 0.8560 | 0.8567 | 0.8577 | 0.8588 | 0.8595 | 0.8605 |
| Pivot points | S3 | S2 | S1 | PP | R1 | R2 | R3 |
|---|---|---|---|---|---|---|---|
| Standard | 0.8456 | 0.8488 | 0.8551 | 0.8583 | 0.8646 | 0.8678 | 0.8741 |
| Camarilla | 0.8587 | 0.8596 | 0.8604 | 0.8613 | 0.8622 | 0.8630 | 0.8639 |
| Woodie | 0.8471 | 0.8496 | 0.8566 | 0.8591 | 0.8661 | 0.8686 | 0.8756 |
| Fibonacci | 0.8488 | 0.8525 | 0.8547 | 0.8583 | 0.8620 | 0.8642 | 0.8678 |
| Pivot points | S3 | S2 | S1 | PP | R1 | R2 | R3 |
|---|---|---|---|---|---|---|---|
| Standard | 0.8395 | 0.8449 | 0.8495 | 0.8549 | 0.8595 | 0.8649 | 0.8695 |
| Camarilla | 0.8514 | 0.8523 | 0.8532 | 0.8541 | 0.8550 | 0.8559 | 0.8569 |
| Woodie | 0.8391 | 0.8447 | 0.8491 | 0.8547 | 0.8591 | 0.8647 | 0.8691 |
| Fibonacci | 0.8449 | 0.8487 | 0.8511 | 0.8549 | 0.8587 | 0.8611 | 0.8649 |
Numerical data
The following is the status of technical indicators and moving averages registered at the time this technical analysis was created:
| RSI (14): | 55.06 | |
| MACD (12,26,9): | -0.0001 | |
| Directional Movement: | 2.6026 | |
| AROON (14): | 71.4286 | |
| DEMA (21): | 0.8576 | |
| Parabolic SAR (0,02-0,02-0,2): | 0.8570 | |
| Elder Ray (13): | 0.0003 | |
| Super Trend (3,10): | 0.8587 | |
| Zig ZAG (10): | 0.8581 | |
| VORTEX (21): | 1.0758 | |
| Stochastique (14,3,5): | 74.73 | |
| TEMA (21): | 0.8579 | |
| Williams %R (14): | -14.29 | |
| Chande Momentum Oscillator (20): | 0.0008 | |
| Repulse (5,40,3): | 0.0669 | |
| ROCnROLL: | -1 | |
| TRIX (15,9): | -0.0033 | |
| Courbe Coppock: | 0.08 |
| MA7: | 0.8591 | |
| MA20: | 0.8571 | |
| MA50: | 0.8560 | |
| MA100: | 0.8574 | |
| MAexp7: | 0.8579 | |
| MAexp20: | 0.8578 | |
| MAexp50: | 0.8583 | |
| MAexp100: | 0.8587 | |
| Price / MA7: | -0.09% | |
| Price / MA20: | +0.14% | |
| Price / MA50: | +0.27% | |
| Price / MA100: | +0.10% | |
| Price / MAexp7: | +0.05% | |
| Price / MAexp20: | +0.06% | |
| Price / MAexp50: | -0% | |
| Price / MAexp100: | -0.05% |
News
The last news published on EUR/GBP at the time of the generation of this analysis was as follows:
-
 EUR/GBP Forecast April 25, 2024
-
Weekly Technical Outlook: 08/04/2024 - USDJPY, EURGBP, USDCAD
-
EUR/GBP Forecast April 2, 2024
-
EUR/GBP Forecast March 29, 2024
-
Technical Analysis: 13/03/2024 - EURGBP starts to take a bullish shape
About author

Online


Add a comment
Comments
0 comments on the analysis EUR/GBP - 1H