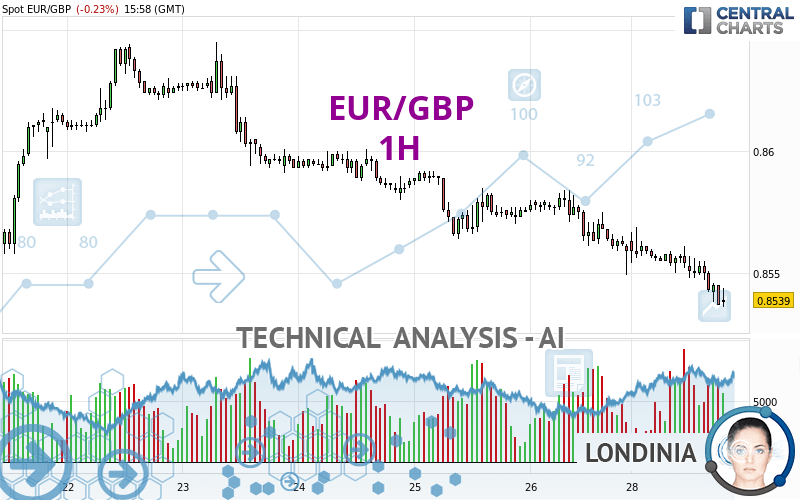
EUR/GBP - 1H - Technical analysis published on 04/29/2024 (GMT)
- 59
- 0
Click here for a new analysis!
- Timeframe : 1H
- - Analysis generated on
- Status : INVALID

Summary of the analysis

Additional analysis
Quotes
EUR/GBP rating 0.8539 GBP. On the day, this instrument lost -0.23% with the lowest point at 0.8536 GBP and the highest point at 0.8569 GBP. The deviation from the price is +0.04% for the low point and -0.35% for the high point.The Central Gaps scanner detects a bullish opening. A small advantage for buyers in the very short term.
Bullish opening
Type : Bullish
Timeframe : Openning
Here is a more detailed summary of the historical variations registered by EUR/GBP:
Near a new LOW record (5 years)
Type : Bearish
Timeframe : Weekly
Near a new HIGH record (1 year)
Type : Bullish
Timeframe : Weekly
Near a new HIGH record (1st january)
Type : Bullish
Timeframe : Weekly
Near a new HIGH record (1 month)
Type : Bullish
Timeframe : Weekly
Technical
A technical analysis in 1H of this EUR/GBP chart shows a sharp bearish trend. 92.86% of the signals given by moving averages are bearish. This strongly bearish trend is supported by the strong bearish signals given by short-term moving averages. There is no crossing of moving average by the price or crossing of moving averages between themselves.
Technical indicators are bearish. There is still some doubt about the decline in the price.
Caution: the Central Indicators scanner currently detects an excess:
CCI indicator is oversold : under -100
Type : Neutral
Timeframe : 1 hour
Previous candle closed under Bollinger bands
Type : Neutral
Timeframe : 1 hour
CCI indicator: bullish divergence
Type : Bullish
Timeframe : 1 hour
Williams %R indicator is oversold : under -80
Type : Neutral
Timeframe : 1 hour
Pivot points : price is under support 1
Type : Neutral
Timeframe : 1 hour
The Central Patterns scanner, which studies chart patterns, resistances and supports, has identified these signals:
Near horizontal support
Type : Bullish
Timeframe : 1 hour
Support of channel is broken
Type : Bearish
Timeframe : 1 hour
For a small rebound in the very short term, the Central Candlesticks scanner currently notes the presence of this bullish pattern in Japanese candlesticks:
Bullish harami
Type : Bullish
Timeframe : 1 hour
| S3 | S2 | S1 | Price | R1 | R2 | R3 | |
|---|---|---|---|---|---|---|---|
| ProTrendLines | 0.8510 | 0.8521 | 0.8536 | 0.8539 | 0.8551 | 0.8580 | 0.8601 |
| Change (%) | -0.34% | -0.21% | -0.04% | - | +0.14% | +0.48% | +0.73% |
| Change | -0.0029 | -0.0018 | -0.0003 | - | +0.0012 | +0.0041 | +0.0062 |
| Level | Major | Minor | Intermediate | - | Major | Major | Minor |
To determine price objectives, it is also possible to use the pivot points. Here is the price position in relation to pivot points:
| Pivot points | S3 | S2 | S1 | PP | R1 | R2 | R3 |
|---|---|---|---|---|---|---|---|
| Standard | 0.8509 | 0.8529 | 0.8544 | 0.8564 | 0.8579 | 0.8599 | 0.8614 |
| Camarilla | 0.8549 | 0.8553 | 0.8556 | 0.8559 | 0.8562 | 0.8565 | 0.8569 |
| Woodie | 0.8507 | 0.8528 | 0.8542 | 0.8563 | 0.8577 | 0.8598 | 0.8612 |
| Fibonacci | 0.8529 | 0.8542 | 0.8551 | 0.8564 | 0.8577 | 0.8586 | 0.8599 |
| Pivot points | S3 | S2 | S1 | PP | R1 | R2 | R3 |
|---|---|---|---|---|---|---|---|
| Standard | 0.8428 | 0.8488 | 0.8524 | 0.8584 | 0.8620 | 0.8680 | 0.8716 |
| Camarilla | 0.8533 | 0.8541 | 0.8550 | 0.8559 | 0.8568 | 0.8577 | 0.8585 |
| Woodie | 0.8415 | 0.8482 | 0.8511 | 0.8578 | 0.8607 | 0.8674 | 0.8703 |
| Fibonacci | 0.8488 | 0.8525 | 0.8548 | 0.8584 | 0.8621 | 0.8644 | 0.8680 |
| Pivot points | S3 | S2 | S1 | PP | R1 | R2 | R3 |
|---|---|---|---|---|---|---|---|
| Standard | 0.8395 | 0.8449 | 0.8495 | 0.8549 | 0.8595 | 0.8649 | 0.8695 |
| Camarilla | 0.8514 | 0.8523 | 0.8532 | 0.8541 | 0.8550 | 0.8559 | 0.8569 |
| Woodie | 0.8391 | 0.8447 | 0.8491 | 0.8547 | 0.8591 | 0.8647 | 0.8691 |
| Fibonacci | 0.8449 | 0.8487 | 0.8511 | 0.8549 | 0.8587 | 0.8611 | 0.8649 |
Numerical data
The following are the details of the technical indicators and moving averages that were collected to generate this technical analysis:
| RSI (14): | 30.08 | |
| MACD (12,26,9): | -0.0007 | |
| Directional Movement: | -17.7227 | |
| AROON (14): | -57.1429 | |
| DEMA (21): | 0.8543 | |
| Parabolic SAR (0,02-0,02-0,2): | 0.8555 | |
| Elder Ray (13): | -0.0008 | |
| Super Trend (3,10): | 0.8562 | |
| Zig ZAG (10): | 0.8539 | |
| VORTEX (21): | 0.8333 | |
| Stochastique (14,3,5): | 15.48 | |
| TEMA (21): | 0.8541 | |
| Williams %R (14): | -84.00 | |
| Chande Momentum Oscillator (20): | -0.0019 | |
| Repulse (5,40,3): | -0.0787 | |
| ROCnROLL: | 2 | |
| TRIX (15,9): | -0.0093 | |
| Courbe Coppock: | 0.30 |
| MA7: | 0.8585 | |
| MA20: | 0.8569 | |
| MA50: | 0.8559 | |
| MA100: | 0.8573 | |
| MAexp7: | 0.8544 | |
| MAexp20: | 0.8552 | |
| MAexp50: | 0.8562 | |
| MAexp100: | 0.8572 | |
| Price / MA7: | -0.54% | |
| Price / MA20: | -0.35% | |
| Price / MA50: | -0.23% | |
| Price / MA100: | -0.40% | |
| Price / MAexp7: | -0.06% | |
| Price / MAexp20: | -0.15% | |
| Price / MAexp50: | -0.27% | |
| Price / MAexp100: | -0.38% |
News
The last news published on EUR/GBP at the time of the generation of this analysis was as follows:
-
 EUR/GBP Forecast April 25, 2024
-
Weekly Technical Outlook: 08/04/2024 - USDJPY, EURGBP, USDCAD
-
EUR/GBP Forecast April 2, 2024
-
EUR/GBP Forecast March 29, 2024
-
Technical Analysis: 13/03/2024 - EURGBP starts to take a bullish shape
About author

Online


Add a comment
Comments
0 comments on the analysis EUR/GBP - 1H