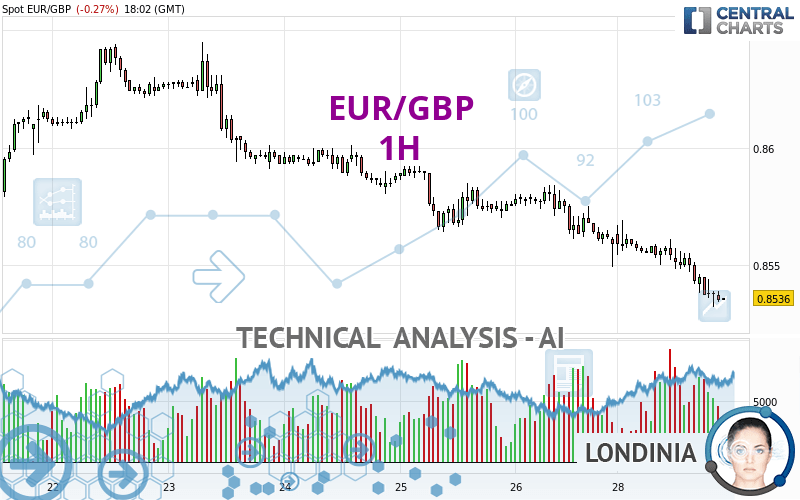
EUR/GBP - 1H - Technical analysis published on 04/29/2024 (GMT)
- 56
- 0
Click here for a new analysis!
- Timeframe : 1H
- - Analysis generated on
- Status : INVALID

Summary of the analysis

Additional analysis
Quotes
EUR/GBP rating 0.8536 GBP. On the day, this instrument lost -0.27% and was traded between 0.8532 GBP and 0.8569 GBP over the period. The price is currently at +0.05% from its lowest and -0.39% from its highest.The Central Gaps scanner detects a bullish opening marking the presence of buyers ahead of sellers at the opening but not sufficiently marked to allow the price to register a quotation gap.
Bullish opening
Type : Bullish
Timeframe : Openning
So that you have an overall view of the price change, here is a table showing the variations over several periods:
Near a new LOW record (5 years)
Type : Bearish
Timeframe : Weekly
Near a new HIGH record (1 year)
Type : Bullish
Timeframe : Weekly
Near a new HIGH record (1st january)
Type : Bullish
Timeframe : Weekly
Near a new HIGH record (1 month)
Type : Bullish
Timeframe : Weekly
Technical
Technical analysis of this 1H chart of EUR/GBP indicates that the overall trend is strongly bearish. 92.86% of the signals given by moving averages are bearish. This strongly bearish trend is supported by the strong bearish signals given by short-term moving averages. The Central Indicators scanner does not detect any result on moving averages that would impact this trend.
In fact, according to the parameters integrated into the Central Analyzer system, 13 technical indicators out of 18 analysed are currently bearish. Caution: the Central Indicators scanner currently detects an excess:
RSI indicator is oversold : under 30
Type : Neutral
Timeframe : 1 hour
CCI indicator is oversold : under -100
Type : Neutral
Timeframe : 1 hour
Williams %R indicator is oversold : under -80
Type : Neutral
Timeframe : 1 hour
Pivot points : price is under support 1
Type : Neutral
Timeframe : 1 hour
Central Patterns, the market scanner focusing on chart patterns, resistances and supports found these results:
Near horizontal support
Type : Bullish
Timeframe : 1 hour
Support of channel is broken
Type : Bearish
Timeframe : 1 hour
No result was found by the Central Candlesticks scanner on Japanese candlesticks.
| S3 | S2 | S1 | Price | R1 | R2 | R3 | |
|---|---|---|---|---|---|---|---|
| ProTrendLines | 0.8510 | 0.8521 | 0.8536 | 0.8536 | 0.8551 | 0.8580 | 0.8601 |
| Change (%) | -0.30% | -0.18% | 0% | - | +0.18% | +0.52% | +0.76% |
| Change | -0.0026 | -0.0015 | 0 | - | +0.0015 | +0.0044 | +0.0065 |
| Level | Major | Minor | Intermediate | - | Major | Major | Minor |
Attention could also be paid to pivot points to set price objectives:
| Pivot points | S3 | S2 | S1 | PP | R1 | R2 | R3 |
|---|---|---|---|---|---|---|---|
| Standard | 0.8509 | 0.8529 | 0.8544 | 0.8564 | 0.8579 | 0.8599 | 0.8614 |
| Camarilla | 0.8549 | 0.8553 | 0.8556 | 0.8559 | 0.8562 | 0.8565 | 0.8569 |
| Woodie | 0.8507 | 0.8528 | 0.8542 | 0.8563 | 0.8577 | 0.8598 | 0.8612 |
| Fibonacci | 0.8529 | 0.8542 | 0.8551 | 0.8564 | 0.8577 | 0.8586 | 0.8599 |
| Pivot points | S3 | S2 | S1 | PP | R1 | R2 | R3 |
|---|---|---|---|---|---|---|---|
| Standard | 0.8428 | 0.8488 | 0.8524 | 0.8584 | 0.8620 | 0.8680 | 0.8716 |
| Camarilla | 0.8533 | 0.8541 | 0.8550 | 0.8559 | 0.8568 | 0.8577 | 0.8585 |
| Woodie | 0.8415 | 0.8482 | 0.8511 | 0.8578 | 0.8607 | 0.8674 | 0.8703 |
| Fibonacci | 0.8488 | 0.8525 | 0.8548 | 0.8584 | 0.8621 | 0.8644 | 0.8680 |
| Pivot points | S3 | S2 | S1 | PP | R1 | R2 | R3 |
|---|---|---|---|---|---|---|---|
| Standard | 0.8395 | 0.8449 | 0.8495 | 0.8549 | 0.8595 | 0.8649 | 0.8695 |
| Camarilla | 0.8514 | 0.8523 | 0.8532 | 0.8541 | 0.8550 | 0.8559 | 0.8569 |
| Woodie | 0.8391 | 0.8447 | 0.8491 | 0.8547 | 0.8591 | 0.8647 | 0.8691 |
| Fibonacci | 0.8449 | 0.8487 | 0.8511 | 0.8549 | 0.8587 | 0.8611 | 0.8649 |
Numerical data
The following are the details of the technical indicators and moving averages that were collected to generate this technical analysis:
| RSI (14): | 26.19 | |
| MACD (12,26,9): | -0.0007 | |
| Directional Movement: | -19.4462 | |
| AROON (14): | -64.2857 | |
| DEMA (21): | 0.8540 | |
| Parabolic SAR (0,02-0,02-0,2): | 0.8550 | |
| Elder Ray (13): | -0.0009 | |
| Super Trend (3,10): | 0.8557 | |
| Zig ZAG (10): | 0.8535 | |
| VORTEX (21): | 0.8529 | |
| Stochastique (14,3,5): | 13.01 | |
| TEMA (21): | 0.8537 | |
| Williams %R (14): | -89.66 | |
| Chande Momentum Oscillator (20): | -0.0021 | |
| Repulse (5,40,3): | -0.0688 | |
| ROCnROLL: | 2 | |
| TRIX (15,9): | -0.0102 | |
| Courbe Coppock: | 0.38 |
| MA7: | 0.8584 | |
| MA20: | 0.8569 | |
| MA50: | 0.8559 | |
| MA100: | 0.8573 | |
| MAexp7: | 0.8541 | |
| MAexp20: | 0.8549 | |
| MAexp50: | 0.8560 | |
| MAexp100: | 0.8570 | |
| Price / MA7: | -0.56% | |
| Price / MA20: | -0.39% | |
| Price / MA50: | -0.27% | |
| Price / MA100: | -0.43% | |
| Price / MAexp7: | -0.06% | |
| Price / MAexp20: | -0.15% | |
| Price / MAexp50: | -0.28% | |
| Price / MAexp100: | -0.40% |
News
Don't forget to follow the news on EUR/GBP. At the time of publication of this analysis, the latest news was as follows:
-
 EUR/GBP Forecast April 25, 2024
-
Weekly Technical Outlook: 08/04/2024 - USDJPY, EURGBP, USDCAD
-
EUR/GBP Forecast April 2, 2024
-
EUR/GBP Forecast March 29, 2024
-
Technical Analysis: 13/03/2024 - EURGBP starts to take a bullish shape
About author

Online


Add a comment
Comments
0 comments on the analysis EUR/GBP - 1H