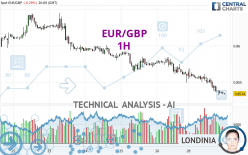
EUR/GBP - 1H - Technical analysis published on 04/29/2024 (GMT)
- 85
- 0
Click here for a new analysis!
- Timeframe : 1H
- - Analysis generated on
- Status : INVALID

Summary of the analysis

Additional analysis
Quotes
The EUR/GBP price is 0.8534 GBP. The price is lower by -0.29% since the last closing and was between 0.8532 GBP and 0.8569 GBP. This implies that the price is at +0.02% from its lowest and at -0.41% from its highest.A bullish opening was detected by the Central Gaps scanner. Buyers are trying to impose a bullish momentum in the very short term.
Bullish opening
Type : Bullish
Timeframe : Openning
So that you have an overall view of the price change, here is a table showing the variations over several periods:
Near a new LOW record (5 years)
Type : Bearish
Timeframe : Weekly
Near a new HIGH record (1 year)
Type : Bullish
Timeframe : Weekly
Near a new HIGH record (1st january)
Type : Bullish
Timeframe : Weekly
Near a new HIGH record (1 month)
Type : Bullish
Timeframe : Weekly
Technical
Technical analysis of this 1H chart of EUR/GBP indicates that the overall trend is strongly bearish. 92.86% of the signals given by moving averages are bearish. This strongly bearish trend is supported by the strong bearish signals given by short-term moving averages. The Central Indicators market scanner currently does not detect any result that concerns moving averages.
In fact, 13 technical indicators on 18 studied are currently bearish. Caution: the Central Indicators scanner currently detects an excess:
RSI indicator is oversold : under 30
Type : Neutral
Timeframe : 1 hour
CCI indicator is oversold : under -100
Type : Neutral
Timeframe : 1 hour
Williams %R indicator is oversold : under -80
Type : Neutral
Timeframe : 1 hour
Pivot points : price is under support 1
Type : Neutral
Timeframe : 1 hour
Central Patterns, the market scanner focusing on chart patterns, resistances and supports found these results:
Near horizontal support
Type : Bullish
Timeframe : 1 hour
Support of channel is broken
Type : Bearish
Timeframe : 1 hour
The Central Candlesticks scanner which studies Japanese candlesticks did not detect anything.
| S3 | S2 | S1 | Price | R1 | R2 | R3 | |
|---|---|---|---|---|---|---|---|
| ProTrendLines | 0.8364 | 0.8510 | 0.8521 | 0.8534 | 0.8536 | 0.8551 | 0.8580 |
| Change (%) | -1.99% | -0.28% | -0.15% | - | +0.02% | +0.20% | +0.54% |
| Change | -0.0170 | -0.0024 | -0.0013 | - | +0.0002 | +0.0017 | +0.0046 |
| Level | Minor | Major | Minor | - | Intermediate | Major | Major |
Pivot points can also be used to set your price objectives. Here is the price situation in relation to pivot points:
| Pivot points | S3 | S2 | S1 | PP | R1 | R2 | R3 |
|---|---|---|---|---|---|---|---|
| Standard | 0.8509 | 0.8529 | 0.8544 | 0.8564 | 0.8579 | 0.8599 | 0.8614 |
| Camarilla | 0.8549 | 0.8553 | 0.8556 | 0.8559 | 0.8562 | 0.8565 | 0.8569 |
| Woodie | 0.8507 | 0.8528 | 0.8542 | 0.8563 | 0.8577 | 0.8598 | 0.8612 |
| Fibonacci | 0.8529 | 0.8542 | 0.8551 | 0.8564 | 0.8577 | 0.8586 | 0.8599 |
| Pivot points | S3 | S2 | S1 | PP | R1 | R2 | R3 |
|---|---|---|---|---|---|---|---|
| Standard | 0.8428 | 0.8488 | 0.8524 | 0.8584 | 0.8620 | 0.8680 | 0.8716 |
| Camarilla | 0.8533 | 0.8541 | 0.8550 | 0.8559 | 0.8568 | 0.8577 | 0.8585 |
| Woodie | 0.8415 | 0.8482 | 0.8511 | 0.8578 | 0.8607 | 0.8674 | 0.8703 |
| Fibonacci | 0.8488 | 0.8525 | 0.8548 | 0.8584 | 0.8621 | 0.8644 | 0.8680 |
| Pivot points | S3 | S2 | S1 | PP | R1 | R2 | R3 |
|---|---|---|---|---|---|---|---|
| Standard | 0.8395 | 0.8449 | 0.8495 | 0.8549 | 0.8595 | 0.8649 | 0.8695 |
| Camarilla | 0.8514 | 0.8523 | 0.8532 | 0.8541 | 0.8550 | 0.8559 | 0.8569 |
| Woodie | 0.8391 | 0.8447 | 0.8491 | 0.8547 | 0.8591 | 0.8647 | 0.8691 |
| Fibonacci | 0.8449 | 0.8487 | 0.8511 | 0.8549 | 0.8587 | 0.8611 | 0.8649 |
Numerical data
The following are the details of the technical indicators and moving averages that were collected to generate this technical analysis:
| RSI (14): | 26.58 | |
| MACD (12,26,9): | -0.0008 | |
| Directional Movement: | -18.8694 | |
| AROON (14): | -64.2857 | |
| DEMA (21): | 0.8535 | |
| Parabolic SAR (0,02-0,02-0,2): | 0.8543 | |
| Elder Ray (13): | -0.0007 | |
| Super Trend (3,10): | 0.8552 | |
| Zig ZAG (10): | 0.8534 | |
| VORTEX (21): | 0.7967 | |
| Stochastique (14,3,5): | 10.34 | |
| TEMA (21): | 0.8533 | |
| Williams %R (14): | -93.10 | |
| Chande Momentum Oscillator (20): | -0.0017 | |
| Repulse (5,40,3): | -0.0030 | |
| ROCnROLL: | 2 | |
| TRIX (15,9): | -0.0114 | |
| Courbe Coppock: | 0.42 |
| MA7: | 0.8584 | |
| MA20: | 0.8569 | |
| MA50: | 0.8559 | |
| MA100: | 0.8573 | |
| MAexp7: | 0.8537 | |
| MAexp20: | 0.8545 | |
| MAexp50: | 0.8558 | |
| MAexp100: | 0.8568 | |
| Price / MA7: | -0.58% | |
| Price / MA20: | -0.41% | |
| Price / MA50: | -0.29% | |
| Price / MA100: | -0.45% | |
| Price / MAexp7: | -0.04% | |
| Price / MAexp20: | -0.13% | |
| Price / MAexp50: | -0.28% | |
| Price / MAexp100: | -0.40% |
News
Don't forget to follow the news on EUR/GBP. At the time of publication of this analysis, the latest news was as follows:
-
 EUR/GBP Forecast April 25, 2024
-
Weekly Technical Outlook: 08/04/2024 - USDJPY, EURGBP, USDCAD
-
EUR/GBP Forecast April 2, 2024
-
EUR/GBP Forecast March 29, 2024
-
Technical Analysis: 13/03/2024 - EURGBP starts to take a bullish shape
About author

Online


Add a comment
Comments
0 comments on the analysis EUR/GBP - 1H