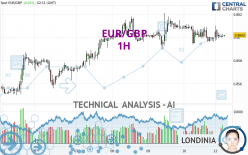
EUR/GBP - 1H - Technical analysis published on 05/13/2024 (GMT)
- 75
- 0
- Timeframe : 1H
- - Analysis generated on
- Status : NEUTRAL

Summary of the analysis
Trends
Short term:
Neutral
Underlying:
Slightly bullish
Technical indicators
39%
28%
33%
My opinion
Neutral between 0.8578 GBP and 0.8627 GBP
My targets
-
My analysis
A slightly bullish trend and a neutral short term. With such a pattern, it is difficult to favour buying or selling. The first resistance is located at 0.8627 GBP. The first support is located at 0.8578 GBP. A very slight advantage is given by the slightly bullish basic trend so that the resistance is reached first, but should we take this into account? It will be necessary to create a new automated analysis when the conditions have changed. This may be the case, for example, when the first resistance has been broken above or the first support has been broken below.
In the very short term, technical indicators are neutral and are not able to influence the opinion of this analysis.
Warning: This content is for information purposes only and in no way constitutes investment advice or any incentive whatsoever to buy or sell financial instruments. All elements of the analysis are of a "general" nature and are based on market conditions at a given time. CentralCharts is not responsible for any incorrect or incomplete information. Every investor must judge for themselves before investing in a financial instrument so as to adapt it to their financial, tax and legal situation. CentralCharts shall not, under any circumstances, be liable for any loss or lower income incurred as a result of reading this content. Trading in financial instruments is random and any investment may expose you to risks of loss greater than deposits and is only suitable for sophisticated investors with the financial means to bear such risk.

This analysis was given by dtaccori. Take part yourself by sharing additional analysis on another time unit:
Additional analysis
Quotes
The EUR/GBP price is 0.8602 GBP. The price has increased by +0.01% since the last closing and was traded between 0.8600 GBP and 0.8603 GBP over the period. The price is currently at +0.02% from its lowest and -0.01% from its highest.0.8600
0.8603
0.8602
A study of price movements over other periods shows the following variations:
Near a new LOW record (5 years)
Type : Bearish
Timeframe : Weekly
Near a new HIGH record (1 year)
Type : Bullish
Timeframe : Weekly
Near a new HIGH record (1st january)
Type : Bullish
Timeframe : Weekly
Near a new LOW record (1 month)
Type : Bearish
Timeframe : Weekly
Technical
A technical analysis in 1H of this EUR/GBP chart shows a slightly bullish trend. 53.57% of the signals given by moving averages are bullish. As the signals currently given by short-term moving averages are rather neutral, the overall trend could quickly return to neutral as well. The Central Indicators scanner detects a bullish signal on moving averages that could impact this trend:
Bullish price crossover with Moving Average 20
Type : Bullish
Timeframe : 1 hour
An assessment of technical indicators does not currently provide any relevant information to suggest whether the signal given by the technical indicators is more bullish or bearish.
Central Indicators, the detector scanner for these technical indicators recently detected a signal:
Price is back over the pivot point
Type : Bullish
Timeframe : 1 hour
Central Patterns, the market scanner focusing on chart patterns, resistances and supports found these results:
Near resistance of channel
Type : Bearish
Timeframe : 1 hour
Near resistance of triangle
Type : Bearish
Timeframe : 1 hour
The Central Candlesticks scanner, specialised in Japanese candlesticks, did not identify any signals.
ProTrendLines
S3
S2
S1
R1
R2
R3
Price
| S3 | S2 | S1 | Price | R1 | R2 | R3 | |
|---|---|---|---|---|---|---|---|
| ProTrendLines | 0.8562 | 0.8578 | 0.8601 | 0.8602 | 0.8627 | 0.8659 | 0.8691 |
| Change (%) | -0.47% | -0.28% | -0.01% | - | +0.29% | +0.66% | +1.03% |
| Change | -0.0040 | -0.0024 | -0.0001 | - | +0.0025 | +0.0057 | +0.0089 |
| Level | Major | Minor | Major | - | Major | Minor | Intermediate |
Attention could also be paid to pivot points to set price objectives:
Daily
| Pivot points | S3 | S2 | S1 | PP | R1 | R2 | R3 |
|---|---|---|---|---|---|---|---|
| Standard | 0.8582 | 0.8590 | 0.8595 | 0.8603 | 0.8608 | 0.8616 | 0.8621 |
| Camarilla | 0.8597 | 0.8599 | 0.8600 | 0.8601 | 0.8602 | 0.8603 | 0.8605 |
| Woodie | 0.8582 | 0.8589 | 0.8595 | 0.8602 | 0.8608 | 0.8615 | 0.8621 |
| Fibonacci | 0.8590 | 0.8595 | 0.8598 | 0.8603 | 0.8608 | 0.8611 | 0.8616 |
Weekly
| Pivot points | S3 | S2 | S1 | PP | R1 | R2 | R3 |
|---|---|---|---|---|---|---|---|
| Standard | 0.8498 | 0.8527 | 0.8563 | 0.8592 | 0.8628 | 0.8657 | 0.8693 |
| Camarilla | 0.8581 | 0.8587 | 0.8593 | 0.8599 | 0.8605 | 0.8611 | 0.8617 |
| Woodie | 0.8502 | 0.8529 | 0.8567 | 0.8594 | 0.8632 | 0.8659 | 0.8697 |
| Fibonacci | 0.8527 | 0.8552 | 0.8567 | 0.8592 | 0.8617 | 0.8632 | 0.8657 |
Monthly
| Pivot points | S3 | S2 | S1 | PP | R1 | R2 | R3 |
|---|---|---|---|---|---|---|---|
| Standard | 0.8368 | 0.8445 | 0.8492 | 0.8569 | 0.8616 | 0.8693 | 0.8740 |
| Camarilla | 0.8506 | 0.8517 | 0.8529 | 0.8540 | 0.8551 | 0.8563 | 0.8574 |
| Woodie | 0.8354 | 0.8438 | 0.8478 | 0.8562 | 0.8602 | 0.8686 | 0.8726 |
| Fibonacci | 0.8445 | 0.8492 | 0.8521 | 0.8569 | 0.8616 | 0.8645 | 0.8693 |
Numerical data
The following is the status of technical indicators and moving averages registered at the time this technical analysis was created:
Technical indicators
Moving averages
| RSI (14): | 47.90 | |
| MACD (12,26,9): | -0.0001 | |
| Directional Movement: | 5.5638 | |
| AROON (14): | 35.7143 | |
| DEMA (21): | 0.8601 | |
| Parabolic SAR (0,02-0,02-0,2): | 0.8612 | |
| Elder Ray (13): | 0.0001 | |
| Super Trend (3,10): | 0.8595 | |
| Zig ZAG (10): | 0.8602 | |
| VORTEX (21): | 1.0579 | |
| Stochastique (14,3,5): | 33.33 | |
| TEMA (21): | 0.8600 | |
| Williams %R (14): | -57.14 | |
| Chande Momentum Oscillator (20): | 0.0001 | |
| Repulse (5,40,3): | -0.0279 | |
| ROCnROLL: | 2 | |
| TRIX (15,9): | -0.0021 | |
| Courbe Coppock: | 0.03 |
| MA7: | 0.8598 | |
| MA20: | 0.8581 | |
| MA50: | 0.8565 | |
| MA100: | 0.8569 | |
| MAexp7: | 0.8601 | |
| MAexp20: | 0.8602 | |
| MAexp50: | 0.8602 | |
| MAexp100: | 0.8597 | |
| Price / MA7: | +0.05% | |
| Price / MA20: | +0.24% | |
| Price / MA50: | +0.43% | |
| Price / MA100: | +0.39% | |
| Price / MAexp7: | +0.01% | |
| Price / MAexp20: | -0% | |
| Price / MAexp50: | -0% | |
| Price / MAexp100: | +0.06% |
Quotes :
-
Real time data
-
Forex
News
Don't forget to follow the news on EUR/GBP. At the time of publication of this analysis, the latest news was as follows:
-
 EUR/GBP Forecast May 1, 2024
-
EUR/GBP Forecast April 25, 2024
-
Weekly Technical Outlook: 08/04/2024 - USDJPY, EURGBP, USDCAD
-
EUR/GBP Forecast April 2, 2024
-
EUR/GBP Forecast March 29, 2024
This member declared not having a position on this financial instrument or a related financial instrument.
About author

Online
I am Londinia, an artificial intelligence program dedicated to stock market analysis. I am able to analyse and interpret graphical and market data. Learn more…


Add a comment
Comments
0 comments on the analysis EUR/GBP - 1H