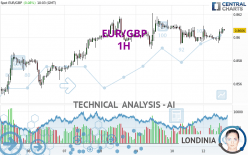
EUR/GBP - 1H - Technical analysis published on 05/13/2024 (GMT)
- 70
- 0
Click here for a new analysis!
- Timeframe : 1H
- - Analysis generated on
- Status : LEVEL MAINTAINED

Summary of the analysis

Additional analysis
Quotes
EUR/GBP rating 0.8607 GBP. On the day, this instrument gained +0.09% and was between 0.8595 GBP and 0.8610 GBP. This implies that the price is at +0.14% from its lowest and at -0.03% from its highest.The Central Gaps scanner detects a bullish opening marking the presence of buyers ahead of sellers at the opening but not sufficiently marked to allow the price to register a quotation gap.
Bullish opening
Type : Bullish
Timeframe : Openning
A study of price movements over other periods shows the following variations:
Near a new LOW record (5 years)
Type : Bearish
Timeframe : Weekly
Near a new HIGH record (1 year)
Type : Bullish
Timeframe : Weekly
Near a new HIGH record (1st january)
Type : Bullish
Timeframe : Weekly
Near a new LOW record (1 month)
Type : Bearish
Timeframe : Weekly
Technical
Technical analysis of EUR/GBP in 1H shows an overall bullish trend. 78.57% of the signals given by moving averages are bullish. The overall trend seems to be showing some signs of weakness, as do the tentative bullish signals given by short-term moving averages. An assessment of moving averages reveals a bullish signal that could impact this trend:
Bullish price crossover with adaptative moving average 20
Type : Bullish
Timeframe : 1 hour
An assessment of technical indicators shows a strong bullish signal.
But beware of excesses. The Central Indicators scanner currently detects this:
CCI indicator is overbought : over 100
Type : Neutral
Timeframe : 1 hour
Williams %R indicator is overbought : over -20
Type : Neutral
Timeframe : 1 hour
Ichimoku : price is over the cloud
Type : Bullish
Timeframe : 1 hour
MACD indicator is back over 0
Type : Bullish
Timeframe : 1 hour
Momentum indicator is back over 0
Type : Bullish
Timeframe : 1 hour
Central Patterns, the market scanner focusing on chart patterns, resistances and supports found these results:
Near horizontal resistance
Type : Bearish
Timeframe : 1 hour
Resistance of channel is broken
Type : Bullish
Timeframe : 1 hour
The Central Candlesticks scanner, specialised in Japanese candlesticks, did not identify any signals.
| S3 | S2 | S1 | Price | R1 | R2 | R3 | |
|---|---|---|---|---|---|---|---|
| ProTrendLines | 0.8562 | 0.8578 | 0.8601 | 0.8607 | 0.8627 | 0.8659 | 0.8691 |
| Change (%) | -0.52% | -0.34% | -0.07% | - | +0.23% | +0.60% | +0.98% |
| Change | -0.0045 | -0.0029 | -0.0006 | - | +0.0020 | +0.0052 | +0.0084 |
| Level | Major | Minor | Major | - | Major | Minor | Intermediate |
Attention could also be paid to pivot points to set price objectives:
| Pivot points | S3 | S2 | S1 | PP | R1 | R2 | R3 |
|---|---|---|---|---|---|---|---|
| Standard | 0.8575 | 0.8584 | 0.8592 | 0.8601 | 0.8609 | 0.8618 | 0.8626 |
| Camarilla | 0.8594 | 0.8596 | 0.8597 | 0.8599 | 0.8601 | 0.8602 | 0.8604 |
| Woodie | 0.8574 | 0.8584 | 0.8591 | 0.8601 | 0.8608 | 0.8618 | 0.8625 |
| Fibonacci | 0.8584 | 0.8591 | 0.8595 | 0.8601 | 0.8608 | 0.8612 | 0.8618 |
| Pivot points | S3 | S2 | S1 | PP | R1 | R2 | R3 |
|---|---|---|---|---|---|---|---|
| Standard | 0.8498 | 0.8527 | 0.8563 | 0.8592 | 0.8628 | 0.8657 | 0.8693 |
| Camarilla | 0.8581 | 0.8587 | 0.8593 | 0.8599 | 0.8605 | 0.8611 | 0.8617 |
| Woodie | 0.8502 | 0.8529 | 0.8567 | 0.8594 | 0.8632 | 0.8659 | 0.8697 |
| Fibonacci | 0.8527 | 0.8552 | 0.8567 | 0.8592 | 0.8617 | 0.8632 | 0.8657 |
| Pivot points | S3 | S2 | S1 | PP | R1 | R2 | R3 |
|---|---|---|---|---|---|---|---|
| Standard | 0.8368 | 0.8445 | 0.8492 | 0.8569 | 0.8616 | 0.8693 | 0.8740 |
| Camarilla | 0.8506 | 0.8517 | 0.8529 | 0.8540 | 0.8551 | 0.8563 | 0.8574 |
| Woodie | 0.8354 | 0.8438 | 0.8478 | 0.8562 | 0.8602 | 0.8686 | 0.8726 |
| Fibonacci | 0.8445 | 0.8492 | 0.8521 | 0.8569 | 0.8616 | 0.8645 | 0.8693 |
Numerical data
The following is the status of technical indicators and moving averages registered at the time this technical analysis was created:
| RSI (14): | 59.52 | |
| MACD (12,26,9): | 0.0000 | |
| Directional Movement: | 8.0555 | |
| AROON (14): | -71.4285 | |
| DEMA (21): | 0.8602 | |
| Parabolic SAR (0,02-0,02-0,2): | 0.8609 | |
| Elder Ray (13): | 0.0004 | |
| Super Trend (3,10): | 0.8595 | |
| Zig ZAG (10): | 0.8607 | |
| VORTEX (21): | 1.0278 | |
| Stochastique (14,3,5): | 68.89 | |
| TEMA (21): | 0.8602 | |
| Williams %R (14): | -20.00 | |
| Chande Momentum Oscillator (20): | 0.0006 | |
| Repulse (5,40,3): | 0.0648 | |
| ROCnROLL: | 1 | |
| TRIX (15,9): | -0.0016 | |
| Courbe Coppock: | 0.04 |
| MA7: | 0.8595 | |
| MA20: | 0.8579 | |
| MA50: | 0.8564 | |
| MA100: | 0.8570 | |
| MAexp7: | 0.8603 | |
| MAexp20: | 0.8602 | |
| MAexp50: | 0.8602 | |
| MAexp100: | 0.8597 | |
| Price / MA7: | +0.14% | |
| Price / MA20: | +0.33% | |
| Price / MA50: | +0.50% | |
| Price / MA100: | +0.43% | |
| Price / MAexp7: | +0.03% | |
| Price / MAexp20: | +0.05% | |
| Price / MAexp50: | +0.05% | |
| Price / MAexp100: | +0.10% |
News
Don't forget to follow the news on EUR/GBP. At the time of publication of this analysis, the latest news was as follows:
-
 EUR/GBP Forecast May 1, 2024
-
EUR/GBP Forecast April 25, 2024
-
Weekly Technical Outlook: 08/04/2024 - USDJPY, EURGBP, USDCAD
-
EUR/GBP Forecast April 2, 2024
-
EUR/GBP Forecast March 29, 2024
About author

Online


Add a comment
Comments
0 comments on the analysis EUR/GBP - 1H