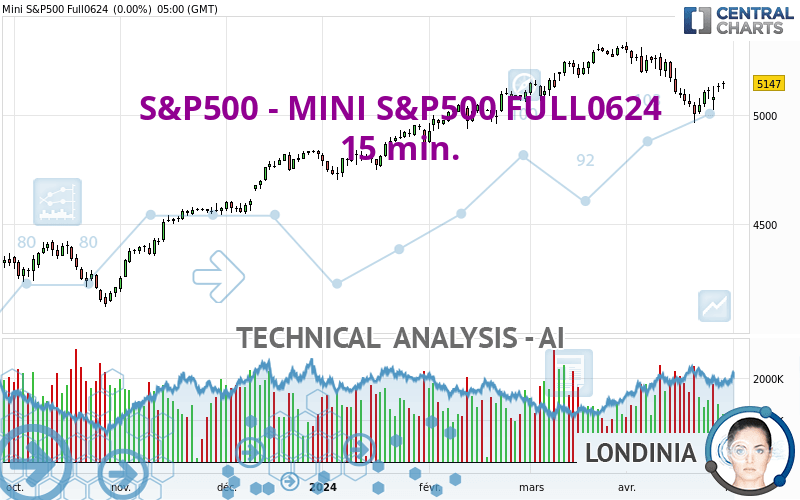
S&P500 - MINI S&P500 FULL0624 - 15 min. - Technical analysis published on 04/30/2024 (GMT)
- 53
- 0
Click here for a new analysis!
- Timeframe : 15 min.
- - Analysis generated on
- Status : TARGET REACHED

Summary of the analysis

Additional analysis
Quotes
The S&P500 - MINI S&P500 FULL0624 price is 5,128.75 USD. The price is lower by -0.36% since the last closing with the lowest point at 5,120.50 USD and the highest point at 5,148.50 USD. The deviation from the price is +0.16% for the low point and -0.38% for the high point.The Central Gaps scanner detects a bullish opening. A small advantage for buyers in the very short term.
Bullish opening
Type : Bullish
Timeframe : Openning
A study of price movements over other periods shows the following variations:
Near a new HIGH record (5 years)
Type : Bullish
Timeframe : Weekly
Near a new HIGH record (1 year)
Type : Bullish
Timeframe : Weekly
Near a new HIGH record (1st january)
Type : Bullish
Timeframe : Weekly
Near a new HIGH record (1 month)
Type : Bullish
Timeframe : Weekly
Technical
Technical analysis of this 15 min. chart of S&P500 - MINI S&P500 FULL0624 indicates that the overall trend is strongly bearish. 92.86% of the signals given by moving averages are bearish. This strongly bearish trend is supported by the strong bearish signals given by short-term moving averages. The Central Indicators scanner detects bearish signals on moving averages that could impact this trend:
Bearish trend reversal : Moving Average 20
Type : Bearish
Timeframe : 15 minutes
Bearish trend reversal : Moving Average 100
Type : Bearish
Timeframe : 15 minutes
Bearish trend reversal : adaptative moving average 20
Type : Bearish
Timeframe : 15 minutes
Bearish trend reversal : adaptative moving average 50
Type : Bearish
Timeframe : 15 minutes
Bearish trend reversal : adaptative moving average 100
Type : Bearish
Timeframe : 15 minutes
Moving Average bearish crossovers : AMA20 & AMA50
Type : Bearish
Timeframe : 15 minutes
In fact, 11 technical indicators on 18 studied are currently positioned bearish. But beware of excesses. The Central Indicators scanner currently detects this:
CCI indicator is oversold : under -100
Type : Neutral
Timeframe : 15 minutes
Previous candle closed under Bollinger bands
Type : Neutral
Timeframe : 15 minutes
Williams %R indicator is oversold : under -80
Type : Neutral
Timeframe : 15 minutes
No signals are given by Central Patterns, a market scanner specialised in chart patterns, resistances and supports.
The Central Candlesticks scanner, specialised in Japanese candlesticks, did not identify any signals.
| S3 | S2 | S1 | Price | R1 | R2 | R3 | |
|---|---|---|---|---|---|---|---|
| ProTrendLines | 5,022.42 | 5,058.00 | 5,073.75 | 5,128.75 | 5,128.85 | 5,154.25 | 5,203.75 |
| Change (%) | -2.07% | -1.38% | -1.07% | - | +0.00% | +0.50% | +1.46% |
| Change | -106.33 | -70.75 | -55.00 | - | +0.10 | +25.50 | +75.00 |
| Level | Intermediate | Minor | Major | - | Intermediate | Intermediate | Minor |
Pivot points can also be used to set your price objectives. Here is the price situation in relation to pivot points:
| Pivot points | S3 | S2 | S1 | PP | R1 | R2 | R3 |
|---|---|---|---|---|---|---|---|
| Standard | 5,090.25 | 5,104.50 | 5,125.75 | 5,140.00 | 5,161.25 | 5,175.50 | 5,196.75 |
| Camarilla | 5,137.24 | 5,140.49 | 5,143.75 | 5,147.00 | 5,150.25 | 5,153.51 | 5,156.76 |
| Woodie | 5,093.75 | 5,106.25 | 5,129.25 | 5,141.75 | 5,164.75 | 5,177.25 | 5,200.25 |
| Fibonacci | 5,104.50 | 5,118.06 | 5,126.44 | 5,140.00 | 5,153.56 | 5,161.94 | 5,175.50 |
| Pivot points | S3 | S2 | S1 | PP | R1 | R2 | R3 |
|---|---|---|---|---|---|---|---|
| Standard | 4,902.33 | 4,954.17 | 5,042.83 | 5,094.67 | 5,183.33 | 5,235.17 | 5,323.83 |
| Camarilla | 5,092.86 | 5,105.74 | 5,118.62 | 5,131.50 | 5,144.38 | 5,157.26 | 5,170.14 |
| Woodie | 4,920.75 | 4,963.38 | 5,061.25 | 5,103.88 | 5,201.75 | 5,244.38 | 5,342.25 |
| Fibonacci | 4,954.17 | 5,007.84 | 5,041.00 | 5,094.67 | 5,148.34 | 5,181.50 | 5,235.17 |
| Pivot points | S3 | S2 | S1 | PP | R1 | R2 | R3 |
|---|---|---|---|---|---|---|---|
| Standard | 4,964.25 | 5,045.75 | 5,170.50 | 5,252.00 | 5,376.75 | 5,458.25 | 5,583.00 |
| Camarilla | 5,238.53 | 5,257.44 | 5,276.34 | 5,295.25 | 5,314.16 | 5,333.06 | 5,351.97 |
| Woodie | 4,985.88 | 5,056.56 | 5,192.13 | 5,262.81 | 5,398.38 | 5,469.06 | 5,604.63 |
| Fibonacci | 5,045.75 | 5,124.54 | 5,173.21 | 5,252.00 | 5,330.79 | 5,379.46 | 5,458.25 |
Numerical data
The following are the details of the technical indicators and moving averages that were collected to generate this technical analysis:
| RSI (14): | 29.54 | |
| MACD (12,26,9): | -1.6200 | |
| Directional Movement: | -29.48 | |
| AROON (14): | -42.86 | |
| DEMA (21): | 5,137.68 | |
| Parabolic SAR (0,02-0,02-0,2): | 5,145.25 | |
| Elder Ray (13): | -10.17 | |
| Super Trend (3,10): | 5,144.14 | |
| Zig ZAG (10): | 5,127.25 | |
| VORTEX (21): | 0.8100 | |
| Stochastique (14,3,5): | 42.02 | |
| TEMA (21): | 5,135.68 | |
| Williams %R (14): | -76.00 | |
| Chande Momentum Oscillator (20): | -11.50 | |
| Repulse (5,40,3): | -0.1900 | |
| ROCnROLL: | 2 | |
| TRIX (15,9): | 0.0000 | |
| Courbe Coppock: | 0.17 |
| MA7: | 5,106.75 | |
| MA20: | 5,145.43 | |
| MA50: | 5,184.74 | |
| MA100: | 5,055.06 | |
| MAexp7: | 5,133.04 | |
| MAexp20: | 5,138.70 | |
| MAexp50: | 5,140.49 | |
| MAexp100: | 5,140.72 | |
| Price / MA7: | +0.43% | |
| Price / MA20: | -0.32% | |
| Price / MA50: | -1.08% | |
| Price / MA100: | +1.46% | |
| Price / MAexp7: | -0.09% | |
| Price / MAexp20: | -0.20% | |
| Price / MAexp50: | -0.23% | |
| Price / MAexp100: | -0.24% |
About author

Online


Add a comment
Comments
0 comments on the analysis S&P500 - MINI S&P500 FULL0624 - 15 min.