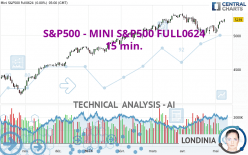
S&P500 - MINI S&P500 FULL0624 - 15 min. - Technical analysis published on 05/10/2024 (GMT)
- 61
- 0
Click here for a new analysis!
- Timeframe : 15 min.
- - Analysis generated on
- Status : LEVEL MAINTAINED

Summary of the analysis

Additional analysis
Quotes
The S&P500 - MINI S&P500 FULL0624 rating is 5,254.25 USD. On the day, this instrument gained +0.29% and was between 5,239.25 USD and 5,260.75 USD. This implies that the price is at +0.29% from its lowest and at -0.12% from its highest.The Central Gaps scanner detects a bullish opening marking the presence of buyers ahead of sellers at the opening but not sufficiently marked to allow the price to register a quotation gap.
Bullish opening
Type : Bullish
Timeframe : Openning
Here is a more detailed summary of the historical variations registered by S&P500 - MINI S&P500 FULL0624:
Near a new HIGH record (5 years)
Type : Bullish
Timeframe : Weekly
Near a new HIGH record (1 year)
Type : Bullish
Timeframe : Weekly
Near a new HIGH record (1st january)
Type : Bullish
Timeframe : Weekly
Near a new HIGH record (1 month)
Type : Bullish
Timeframe : Weekly
Technical
A technical analysis in 15 min. of this S&P500 - MINI S&P500 FULL0624 chart shows a strongly bullish trend. 82.14% of the signals given by moving averages are bullish. The slightly bullish signals given by the short-term moving averages show a weakening of the global trend. The Central Indicators scanner detects bearish signals on moving averages that could impact this trend:
Bearish trend reversal : adaptative moving average 20
Type : Bearish
Timeframe : 15 minutes
Bearish price crossover with adaptative moving average 100
Type : Bearish
Timeframe : 15 minutes
In fact, only 7 technical indicators out of 18 studied are currently bearish. But beware of excesses. The Central Indicators scanner currently detects this:
CCI indicator is oversold : under -100
Type : Neutral
Timeframe : 15 minutes
Williams %R indicator is oversold : under -80
Type : Neutral
Timeframe : 15 minutes
Pivot points : price is over resistance 2
Type : Neutral
Timeframe : Weekly
The analysis of the price chart with Central Patterns scanners does not return any result.
The presence of a bullish Japanese candlestick pattern detected by Central Candlesticks that could cause a very short term rebound was also detected:
Bullish harami
Type : Bullish
Timeframe : 15 minutes
| S3 | S2 | S1 | Price | R1 | |
|---|---|---|---|---|---|
| ProTrendLines | 5,126.75 | 5,169.75 | 5,217.23 | 5,254.25 | 5,308.50 |
| Change (%) | -2.43% | -1.61% | -0.70% | - | +1.03% |
| Change | -127.50 | -84.50 | -37.02 | - | +54.25 |
| Level | Minor | Minor | Intermediate | - | Major |
To determine price objectives, it is also possible to use the pivot points. Here is the price position in relation to pivot points:
| Pivot points | S3 | S2 | S1 | PP | R1 | R2 | R3 |
|---|---|---|---|---|---|---|---|
| Standard | 5,158.00 | 5,176.50 | 5,207.75 | 5,226.25 | 5,257.50 | 5,276.00 | 5,307.25 |
| Camarilla | 5,225.32 | 5,229.88 | 5,234.44 | 5,239.00 | 5,243.56 | 5,248.12 | 5,252.68 |
| Woodie | 5,164.38 | 5,179.69 | 5,214.13 | 5,229.44 | 5,263.88 | 5,279.19 | 5,313.63 |
| Fibonacci | 5,176.50 | 5,195.51 | 5,207.25 | 5,226.25 | 5,245.26 | 5,257.00 | 5,276.00 |
| Pivot points | S3 | S2 | S1 | PP | R1 | R2 | R3 |
|---|---|---|---|---|---|---|---|
| Standard | 4,941.25 | 4,988.75 | 5,071.75 | 5,119.25 | 5,202.25 | 5,249.75 | 5,332.75 |
| Camarilla | 5,118.86 | 5,130.83 | 5,142.79 | 5,154.75 | 5,166.71 | 5,178.68 | 5,190.64 |
| Woodie | 4,959.00 | 4,997.63 | 5,089.50 | 5,128.13 | 5,220.00 | 5,258.63 | 5,350.50 |
| Fibonacci | 4,988.75 | 5,038.60 | 5,069.40 | 5,119.25 | 5,169.10 | 5,199.90 | 5,249.75 |
| Pivot points | S3 | S2 | S1 | PP | R1 | R2 | R3 |
|---|---|---|---|---|---|---|---|
| Standard | 4,558.83 | 4,761.17 | 4,903.83 | 5,106.17 | 5,248.83 | 5,451.17 | 5,593.83 |
| Camarilla | 4,951.63 | 4,983.25 | 5,014.88 | 5,046.50 | 5,078.13 | 5,109.75 | 5,141.38 |
| Woodie | 4,529.00 | 4,746.25 | 4,874.00 | 5,091.25 | 5,219.00 | 5,436.25 | 5,564.00 |
| Fibonacci | 4,761.17 | 4,892.96 | 4,974.38 | 5,106.17 | 5,237.96 | 5,319.38 | 5,451.17 |
Numerical data
The following are the details of the technical indicators and moving averages that were collected to generate this technical analysis:
| RSI (14): | 45.39 | |
| MACD (12,26,9): | 1.6100 | |
| Directional Movement: | 3.48 | |
| AROON (14): | -100.00 | |
| DEMA (21): | 5,256.79 | |
| Parabolic SAR (0,02-0,02-0,2): | 5,259.29 | |
| Elder Ray (13): | -2.53 | |
| Super Trend (3,10): | 5,260.70 | |
| Zig ZAG (10): | 5,250.50 | |
| VORTEX (21): | 1.0200 | |
| Stochastique (14,3,5): | 27.54 | |
| TEMA (21): | 5,255.42 | |
| Williams %R (14): | -97.67 | |
| Chande Momentum Oscillator (20): | -7.25 | |
| Repulse (5,40,3): | -0.0700 | |
| ROCnROLL: | -1 | |
| TRIX (15,9): | 0.0100 | |
| Courbe Coppock: | 0.10 |
| MA7: | 5,195.93 | |
| MA20: | 5,120.90 | |
| MA50: | 5,190.80 | |
| MA100: | 5,083.99 | |
| MAexp7: | 5,253.46 | |
| MAexp20: | 5,254.19 | |
| MAexp50: | 5,248.91 | |
| MAexp100: | 5,240.14 | |
| Price / MA7: | +1.12% | |
| Price / MA20: | +2.60% | |
| Price / MA50: | +1.22% | |
| Price / MA100: | +3.35% | |
| Price / MAexp7: | +0.02% | |
| Price / MAexp20: | +0.00% | |
| Price / MAexp50: | +0.10% | |
| Price / MAexp100: | +0.27% |
About author

Online


Add a comment
Comments
0 comments on the analysis S&P500 - MINI S&P500 FULL0624 - 15 min.