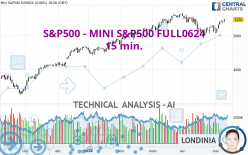
S&P500 - MINI S&P500 FULL0624 - 15 min. - Technical analysis published on 05/10/2024 (GMT)
- 74
- 0
Click here for a new analysis!
- Timeframe : 15 min.
- - Analysis generated on
- Status : LEVEL MAINTAINED

Summary of the analysis

Additional analysis
Quotes
The S&P500 - MINI S&P500 FULL0624 price is 5,244.75 USD. The price registered an increase of +0.11% on the session and was traded between 5,239.25 USD and 5,264.00 USD over the period. The price is currently at +0.10% from its lowest and -0.37% from its highest.The Central Gaps scanner detects a bullish opening marking the presence of buyers ahead of sellers at the opening but not sufficiently marked to allow the price to register a quotation gap.
Bullish opening
Type : Bullish
Timeframe : Openning
So that you have an overall view of the price change, here is a table showing the variations over several periods:
Near a new HIGH record (5 years)
Type : Bullish
Timeframe : Weekly
Near a new HIGH record (1 year)
Type : Bullish
Timeframe : Weekly
Near a new HIGH record (1st january)
Type : Bullish
Timeframe : Weekly
Near a new HIGH record (1 month)
Type : Bullish
Timeframe : Weekly
Technical
A technical analysis in 15 min. of this S&P500 - MINI S&P500 FULL0624 chart shows a slightly bullish trend. 57.14% of the signals given by moving averages are bullish. Caution: the strong bearish signals currently being given by short-term moving averages indicate that this slightly bullish trend could be reversed. An assessment of moving averages reveals several bearish signals that could impact this trend:
Bearish trend reversal : Moving Average 20
Type : Bearish
Timeframe : 15 minutes
Bearish trend reversal : adaptative moving average 20
Type : Bearish
Timeframe : 15 minutes
Bearish price crossover with Moving Average 50
Type : Bearish
Timeframe : 15 minutes
An assessment of technical indicators does not currently provide any relevant information on the direction of future price movements.
Caution: the Central Indicators scanner currently detects an excess:
CCI indicator is oversold : under -100
Type : Neutral
Timeframe : 15 minutes
Williams %R indicator is oversold : under -80
Type : Neutral
Timeframe : 15 minutes
Pivot points : price is over resistance 1
Type : Neutral
Timeframe : Weekly
MACD indicator is back under 0
Type : Bearish
Timeframe : 15 minutes
The analysis of the price chart with Central Patterns scanners does not return any result.
The Central Candlesticks scanner, specialised in Japanese candlesticks, did not identify any signals.
| S3 | S2 | S1 | Price | R1 | |
|---|---|---|---|---|---|
| ProTrendLines | 5,126.75 | 5,169.75 | 5,217.23 | 5,244.75 | 5,308.50 |
| Change (%) | -2.25% | -1.43% | -0.52% | - | +1.22% |
| Change | -118.00 | -75.00 | -27.52 | - | +63.75 |
| Level | Minor | Minor | Intermediate | - | Major |
Pivot points can also be used to set your price objectives. Here is the price situation in relation to pivot points:
| Pivot points | S3 | S2 | S1 | PP | R1 | R2 | R3 |
|---|---|---|---|---|---|---|---|
| Standard | 5,158.00 | 5,176.50 | 5,207.75 | 5,226.25 | 5,257.50 | 5,276.00 | 5,307.25 |
| Camarilla | 5,225.32 | 5,229.88 | 5,234.44 | 5,239.00 | 5,243.56 | 5,248.12 | 5,252.68 |
| Woodie | 5,164.38 | 5,179.69 | 5,214.13 | 5,229.44 | 5,263.88 | 5,279.19 | 5,313.63 |
| Fibonacci | 5,176.50 | 5,195.51 | 5,207.25 | 5,226.25 | 5,245.26 | 5,257.00 | 5,276.00 |
| Pivot points | S3 | S2 | S1 | PP | R1 | R2 | R3 |
|---|---|---|---|---|---|---|---|
| Standard | 4,941.25 | 4,988.75 | 5,071.75 | 5,119.25 | 5,202.25 | 5,249.75 | 5,332.75 |
| Camarilla | 5,118.86 | 5,130.83 | 5,142.79 | 5,154.75 | 5,166.71 | 5,178.68 | 5,190.64 |
| Woodie | 4,959.00 | 4,997.63 | 5,089.50 | 5,128.13 | 5,220.00 | 5,258.63 | 5,350.50 |
| Fibonacci | 4,988.75 | 5,038.60 | 5,069.40 | 5,119.25 | 5,169.10 | 5,199.90 | 5,249.75 |
| Pivot points | S3 | S2 | S1 | PP | R1 | R2 | R3 |
|---|---|---|---|---|---|---|---|
| Standard | 4,558.83 | 4,761.17 | 4,903.83 | 5,106.17 | 5,248.83 | 5,451.17 | 5,593.83 |
| Camarilla | 4,951.63 | 4,983.25 | 5,014.88 | 5,046.50 | 5,078.13 | 5,109.75 | 5,141.38 |
| Woodie | 4,529.00 | 4,746.25 | 4,874.00 | 5,091.25 | 5,219.00 | 5,436.25 | 5,564.00 |
| Fibonacci | 4,761.17 | 4,892.96 | 4,974.38 | 5,106.17 | 5,237.96 | 5,319.38 | 5,451.17 |
Numerical data
The following is the status of technical indicators and moving averages registered at the time this technical analysis was created:
| RSI (14): | 41.32 | |
| MACD (12,26,9): | 0.7700 | |
| Directional Movement: | -5.36 | |
| AROON (14): | -14.29 | |
| DEMA (21): | 5,255.93 | |
| Parabolic SAR (0,02-0,02-0,2): | 5,264.00 | |
| Elder Ray (13): | -4.31 | |
| Super Trend (3,10): | 5,265.35 | |
| Zig ZAG (10): | 5,247.00 | |
| VORTEX (21): | 0.8800 | |
| Stochastique (14,3,5): | 37.24 | |
| TEMA (21): | 5,253.59 | |
| Williams %R (14): | -89.16 | |
| Chande Momentum Oscillator (20): | -10.00 | |
| Repulse (5,40,3): | -0.2200 | |
| ROCnROLL: | 2 | |
| TRIX (15,9): | 0.0000 | |
| Courbe Coppock: | 0.12 |
| MA7: | 5,194.71 | |
| MA20: | 5,120.75 | |
| MA50: | 5,190.73 | |
| MA100: | 5,083.96 | |
| MAexp7: | 5,251.13 | |
| MAexp20: | 5,254.45 | |
| MAexp50: | 5,250.16 | |
| MAexp100: | 5,241.79 | |
| Price / MA7: | +0.96% | |
| Price / MA20: | +2.42% | |
| Price / MA50: | +1.04% | |
| Price / MA100: | +3.16% | |
| Price / MAexp7: | -0.13% | |
| Price / MAexp20: | -0.19% | |
| Price / MAexp50: | -0.11% | |
| Price / MAexp100: | +0.05% |
About author

Online


Add a comment
Comments
0 comments on the analysis S&P500 - MINI S&P500 FULL0624 - 15 min.