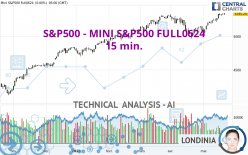
S&P500 - MINI S&P500 FULL0624 - 15 min. - Technical analysis published on 05/22/2024 (GMT)
- 65
- 0
- Timeframe : 15 min.
- - Analysis generated on
- Status : NEUTRAL

Summary of the analysis

Additional analysis
Quotes
S&P500 - MINI S&P500 FULL0624 rating 5,342.00 USD. The price registered a decrease of -0.06% on the session and was traded between 5,332.50 USD and 5,349.25 USD over the period. The price is currently at +0.18% from its lowest and -0.14% from its highest.A bearish opening was detected by the Central Gaps scanner. Sellers are trying to impose a bearish trend in the very short term.
Bearish opening
Type : Bearish
Timeframe : Openning
Here is a more detailed summary of the historical variations registered by S&P500 - MINI S&P500 FULL0624:
New HIGH record (5 years)
Type : Bullish
Timeframe : Weekly
New HIGH record (1 year)
Type : Bullish
Timeframe : Weekly
New HIGH record (1st january)
Type : Bullish
Timeframe : Weekly
New HIGH record (1 month)
Type : Bullish
Timeframe : Weekly
Technical
Technical analysis of this 15 min. chart of S&P500 - MINI S&P500 FULL0624 indicates that the overall trend is not clearly defined. The slightly bullish signals currently given by short-term moving averages could allow the overall trend to return to a slightly bullish trend. The Central Indicators market scanner is currently detecting several bearish and bullish signals that could impact this trend:
Bearish price crossover with Moving Average 20
Type : Bearish
Timeframe : 15 minutes
Bearish price crossover with Moving Average 50
Type : Bearish
Timeframe : 15 minutes
Bearish price crossover with Moving Average 100
Type : Bearish
Timeframe : 15 minutes
Bearish price crossover with adaptative moving average 50
Type : Bearish
Timeframe : 15 minutes
Bullish price crossover with adaptative moving average 100
Type : Bullish
Timeframe : 15 minutes
In fact, only 7 technical indicators out of 18 studied are currently positioned bullish. Caution: the Central Indicators scanner currently detects an excess:
MACD indicator: bearish divergence
Type : Bearish
Timeframe : 15 minutes
RSI indicator is back over 50
Type : Bullish
Timeframe : 15 minutes
The analysis of the price chart with Central Patterns scanners does not return any result.
The Central Candlesticks scanner, specialised in Japanese candlesticks, did not identify any signals.
| S3 | S2 | S1 | Price | R1 | |
|---|---|---|---|---|---|
| ProTrendLines | 5,264.00 | 5,308.50 | 5,322.58 | 5,342.00 | 5,348.62 |
| Change (%) | -1.46% | -0.63% | -0.36% | - | +0.12% |
| Change | -78.00 | -33.50 | -19.42 | - | +6.62 |
| Level | Major | Major | Minor | - | Intermediate |
To determine price objectives, it is also possible to use the pivot points. Here is the price position in relation to pivot points:
| Pivot points | S3 | S2 | S1 | PP | R1 | R2 | R3 |
|---|---|---|---|---|---|---|---|
| Standard | 5,304.33 | 5,313.42 | 5,329.33 | 5,338.42 | 5,354.33 | 5,363.42 | 5,379.33 |
| Camarilla | 5,338.38 | 5,340.67 | 5,342.96 | 5,345.25 | 5,347.54 | 5,349.83 | 5,352.13 |
| Woodie | 5,307.75 | 5,315.13 | 5,332.75 | 5,340.13 | 5,357.75 | 5,365.13 | 5,382.75 |
| Fibonacci | 5,313.42 | 5,322.97 | 5,328.87 | 5,338.42 | 5,347.97 | 5,353.87 | 5,363.42 |
| Pivot points | S3 | S2 | S1 | PP | R1 | R2 | R3 |
|---|---|---|---|---|---|---|---|
| Standard | 5,114.08 | 5,165.42 | 5,246.33 | 5,297.67 | 5,378.58 | 5,429.92 | 5,510.83 |
| Camarilla | 5,290.88 | 5,303.00 | 5,315.13 | 5,327.25 | 5,339.37 | 5,351.50 | 5,363.62 |
| Woodie | 5,128.88 | 5,172.81 | 5,261.13 | 5,305.06 | 5,393.38 | 5,437.31 | 5,525.63 |
| Fibonacci | 5,165.42 | 5,215.94 | 5,247.15 | 5,297.67 | 5,348.19 | 5,379.40 | 5,429.92 |
| Pivot points | S3 | S2 | S1 | PP | R1 | R2 | R3 |
|---|---|---|---|---|---|---|---|
| Standard | 4,558.83 | 4,761.17 | 4,903.83 | 5,106.17 | 5,248.83 | 5,451.17 | 5,593.83 |
| Camarilla | 4,951.63 | 4,983.25 | 5,014.88 | 5,046.50 | 5,078.13 | 5,109.75 | 5,141.38 |
| Woodie | 4,529.00 | 4,746.25 | 4,874.00 | 5,091.25 | 5,219.00 | 5,436.25 | 5,564.00 |
| Fibonacci | 4,761.17 | 4,892.96 | 4,974.38 | 5,106.17 | 5,237.96 | 5,319.38 | 5,451.17 |
Numerical data
The following are the details of the technical indicators and moving averages that were collected to generate this technical analysis:
| RSI (14): | 45.41 | |
| MACD (12,26,9): | 0.2700 | |
| Directional Movement: | -12.57 | |
| AROON (14): | -21.43 | |
| DEMA (21): | 5,340.77 | |
| Parabolic SAR (0,02-0,02-0,2): | 5,344.03 | |
| Elder Ray (13): | -0.44 | |
| Super Trend (3,10): | 5,333.89 | |
| Zig ZAG (10): | 5,340.25 | |
| VORTEX (21): | 1.0100 | |
| Stochastique (14,3,5): | 70.00 | |
| TEMA (21): | 5,341.33 | |
| Williams %R (14): | -36.00 | |
| Chande Momentum Oscillator (20): | -2.25 | |
| Repulse (5,40,3): | 0.0300 | |
| ROCnROLL: | 1 | |
| TRIX (15,9): | 0.0000 | |
| Courbe Coppock: | 0.08 |
| MA7: | 5,324.21 | |
| MA20: | 5,217.65 | |
| MA50: | 5,209.26 | |
| MA100: | 5,119.43 | |
| MAexp7: | 5,341.00 | |
| MAexp20: | 5,340.39 | |
| MAexp50: | 5,340.46 | |
| MAexp100: | 5,340.00 | |
| Price / MA7: | +0.33% | |
| Price / MA20: | +2.38% | |
| Price / MA50: | +2.55% | |
| Price / MA100: | +4.35% | |
| Price / MAexp7: | +0.02% | |
| Price / MAexp20: | +0.03% | |
| Price / MAexp50: | +0.03% | |
| Price / MAexp100: | +0.04% |
About author

Online


Add a comment
Comments
0 comments on the analysis S&P500 - MINI S&P500 FULL0624 - 15 min.