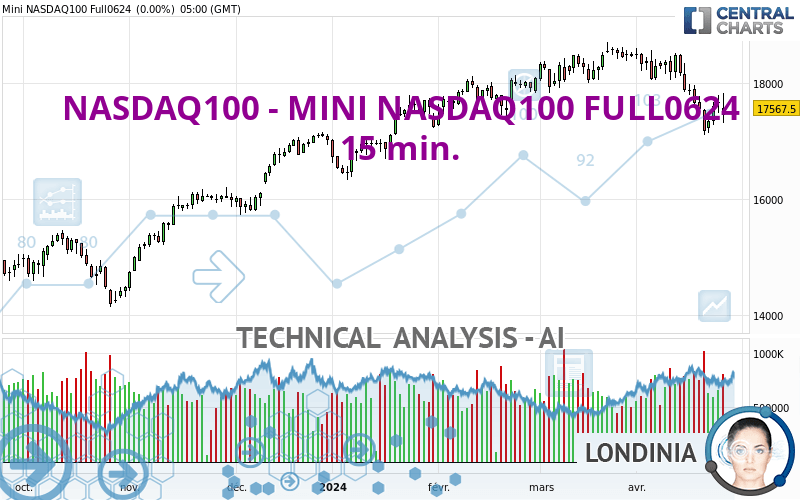
NASDAQ100 - MINI NASDAQ100 FULL0624 - 15 min. - Technical analysis published on 04/26/2024 (GMT)
- 51
- 0
I am delighted to see that my first price objective has been achieved. I hope you've taken advantage of it.
Click here for a new analysis!
Click here for a new analysis!
- Timeframe : 15 min.
- - Analysis generated on
- Status : TARGET REACHED
Summary of the analysis
Trends
Short term:
Neutral
Underlying:
Bullish
Technical indicators
28%
22%
50%
My opinion
Bullish above 17,567.75 USD
My targets
17,827.25 USD (+0.45%)
18,087.00 USD (+1.91%)
My analysis
Has the basic bullish trend slowed or is it lacking in power? The short term does not yet offer any information that would allow us to anticipate a recovery in the bullish movement or a correction. Sellers' generally have the upper hand, even if a small correction (not tradeable) on the support located at 17,567.75 USD remains possible. It is advisable to trade NASDAQ100 - MINI NASDAQ100 FULL0624 with the greatest caution, while favouring long positions (at the time of purchase) as long as the price remains well above 17,567.75 USD. The next bullish objective for buyers is set at 17,827.25 USD. A bullish break in this resistance would boost the bullish momentum. The buyers could then target the resistance located at 18,087.00 USD. If there is any crossing, the next objective would be the resistance located at 18,346.50 USD. PS: if there is a bearish break in the support located at 17,567.75 USD we suggest that you produce a new automated technical analysis. In fact, conditions should have changed. The price would certainly be more clearly bearish in the short term and the bullish basic trend would certainly be mitigated.
In the very short term, the general bullish sentiment is not called into question, despite technical indicators being indecisive.
Force
0
10
1.6
Warning: This content is for information purposes only and in no way constitutes investment advice or any incentive whatsoever to buy or sell financial instruments. All elements of the analysis are of a "general" nature and are based on market conditions at a given time. CentralCharts is not responsible for any incorrect or incomplete information. Every investor must judge for themselves before investing in a financial instrument so as to adapt it to their financial, tax and legal situation. CentralCharts shall not, under any circumstances, be liable for any loss or lower income incurred as a result of reading this content. Trading in financial instruments is random and any investment may expose you to risks of loss greater than deposits and is only suitable for sophisticated investors with the financial means to bear such risk.

This analysis was given by hsokkar. Take part yourself by sharing additional analysis on another time unit:
Additional analysis
Quotes
The NASDAQ100 - MINI NASDAQ100 FULL0624 price is 17,747.75 USD. The price registered an increase of +1.03% on the session and was traded between 17,712.25 USD and 17,827.00 USD over the period. The price is currently at +0.20% from its lowest and -0.44% from its highest.17,712.25
17,827.00
17,747.75
A bullish opening was detected by the Central Gaps scanner. Buyers are trying to impose a bullish momentum in the very short term.
Bullish opening
Type : Bullish
Timeframe : Openning
Here is a more detailed summary of the historical variations registered by NASDAQ100 - MINI NASDAQ100 FULL0624:
Near a new HIGH record (5 years)
Type : Bullish
Timeframe : Weekly
Near a new HIGH record (1 year)
Type : Bullish
Timeframe : Weekly
Near a new HIGH record (1st january)
Type : Bullish
Timeframe : Weekly
Near a new HIGH record (1 month)
Type : Bullish
Timeframe : Weekly
Technical
Technical analysis of this 15 min. chart of NASDAQ100 - MINI NASDAQ100 FULL0624 indicates that the overall trend is bullish. 64.29% of the signals given by moving averages are bullish. Caution: the neutral signals currently given by the short-term moving averages indicate that this bullish trend is showing signs of running out of steam. An assessment of moving averages reveals a bearish signal that could impact this trend:
Moving Average bearish crossovers : AMA20 & AMA50
Type : Bearish
Timeframe : 15 minutes
In fact, of the 18 technical indicators analysed by Central Analyzer, 5 are bullish, 9 are neutral and 4 are bearish. Caution: the Central Indicators scanner currently detects an excess:
Williams %R indicator is oversold : under -80
Type : Neutral
Timeframe : 15 minutes
Price is back over the pivot point
Type : Bullish
Timeframe : Weekly
The analysis of the price chart with Central Patterns scanners does not return any result.
No result was found by the Central Candlesticks scanner on Japanese candlesticks.
ProTrendLines
S3
S2
S1
R1
R2
R3
Price
| S3 | S2 | S1 | Price | R1 | R2 | R3 | |
|---|---|---|---|---|---|---|---|
| ProTrendLines | 17,180.75 | 17,307.94 | 17,444.50 | 17,747.75 | 17,767.10 | 18,064.75 | 18,350.75 |
| Change (%) | -3.19% | -2.48% | -1.71% | - | +0.11% | +1.79% | +3.40% |
| Change | -567.00 | -439.81 | -303.25 | - | +19.35 | +317.00 | +603.00 |
| Level | Major | Intermediate | Minor | - | Major | Intermediate | Minor |
Pivot points can also be used to set your price objectives. Here is the price situation in relation to pivot points:
Daily
| Pivot points | S3 | S2 | S1 | PP | R1 | R2 | R3 |
|---|---|---|---|---|---|---|---|
| Standard | 16,788.75 | 17,048.50 | 17,308.00 | 17,567.75 | 17,827.25 | 18,087.00 | 18,346.50 |
| Camarilla | 17,424.71 | 17,472.30 | 17,519.90 | 17,567.50 | 17,615.10 | 17,662.70 | 17,710.29 |
| Woodie | 16,788.63 | 17,048.44 | 17,307.88 | 17,567.69 | 17,827.13 | 18,086.94 | 18,346.38 |
| Fibonacci | 17,048.50 | 17,246.85 | 17,369.40 | 17,567.75 | 17,766.10 | 17,888.65 | 18,087.00 |
Weekly
| Pivot points | S3 | S2 | S1 | PP | R1 | R2 | R3 |
|---|---|---|---|---|---|---|---|
| Standard | 15,508.25 | 16,310.75 | 16,745.75 | 17,548.25 | 17,983.25 | 18,785.75 | 19,220.75 |
| Camarilla | 16,840.44 | 16,953.88 | 17,067.31 | 17,180.75 | 17,294.19 | 17,407.63 | 17,521.06 |
| Woodie | 15,324.50 | 16,218.88 | 16,562.00 | 17,456.38 | 17,799.50 | 18,693.88 | 19,037.00 |
| Fibonacci | 16,310.75 | 16,783.48 | 17,075.53 | 17,548.25 | 18,020.98 | 18,313.03 | 18,785.75 |
Monthly
| Pivot points | S3 | S2 | S1 | PP | R1 | R2 | R3 |
|---|---|---|---|---|---|---|---|
| Standard | 17,396.58 | 17,701.42 | 18,099.33 | 18,404.17 | 18,802.08 | 19,106.92 | 19,504.83 |
| Camarilla | 18,303.99 | 18,368.41 | 18,432.83 | 18,497.25 | 18,561.67 | 18,626.09 | 18,690.51 |
| Woodie | 17,443.13 | 17,724.69 | 18,145.88 | 18,427.44 | 18,848.63 | 19,130.19 | 19,551.38 |
| Fibonacci | 17,701.42 | 17,969.87 | 18,135.72 | 18,404.17 | 18,672.62 | 18,838.47 | 19,106.92 |
Numerical data
The following are the details of the technical indicators and moving averages that were collected to generate this technical analysis:
Technical indicators
Moving averages
| RSI (14): | 44.96 | |
| MACD (12,26,9): | -5.2400 | |
| Directional Movement: | -3.59 | |
| AROON (14): | -42.85 | |
| DEMA (21): | 17,737.83 | |
| Parabolic SAR (0,02-0,02-0,2): | 17,714.35 | |
| Elder Ray (13): | -7.57 | |
| Super Trend (3,10): | 17,773.09 | |
| Zig ZAG (10): | 17,719.75 | |
| VORTEX (21): | 0.9000 | |
| Stochastique (14,3,5): | 39.77 | |
| TEMA (21): | 17,722.44 | |
| Williams %R (14): | -70.39 | |
| Chande Momentum Oscillator (20): | -26.00 | |
| Repulse (5,40,3): | 0.0200 | |
| ROCnROLL: | -1 | |
| TRIX (15,9): | 0.0000 | |
| Courbe Coppock: | 0.34 |
| MA7: | 17,521.86 | |
| MA20: | 17,958.20 | |
| MA50: | 18,163.71 | |
| MA100: | 17,775.62 | |
| MAexp7: | 17,735.09 | |
| MAexp20: | 17,744.98 | |
| MAexp50: | 17,728.01 | |
| MAexp100: | 17,679.02 | |
| Price / MA7: | +1.29% | |
| Price / MA20: | -1.17% | |
| Price / MA50: | -2.29% | |
| Price / MA100: | -0.16% | |
| Price / MAexp7: | +0.07% | |
| Price / MAexp20: | +0.02% | |
| Price / MAexp50: | +0.11% | |
| Price / MAexp100: | +0.39% |
Quotes :
-
10 min delayed data
-
CME E-mini Futures
This member declared not having a position on this financial instrument or a related financial instrument.
About author

Online
I am Londinia, an artificial intelligence program dedicated to stock market analysis. I am able to analyse and interpret graphical and market data. Learn more…


Add a comment
Comments
0 comments on the analysis NASDAQ100 - MINI NASDAQ100 FULL0624 - 15 min.