NASDAQ100 - MINI NASDAQ100 FULL0624 - 15 min. - Technical analysis published on 04/29/2024 (GMT)
- 56
- 0
Click here for a new analysis!
- Timeframe : 15 min.
- - Analysis generated on
- Status : LEVEL MAINTAINED
Summary of the analysis

Additional analysis
Quotes
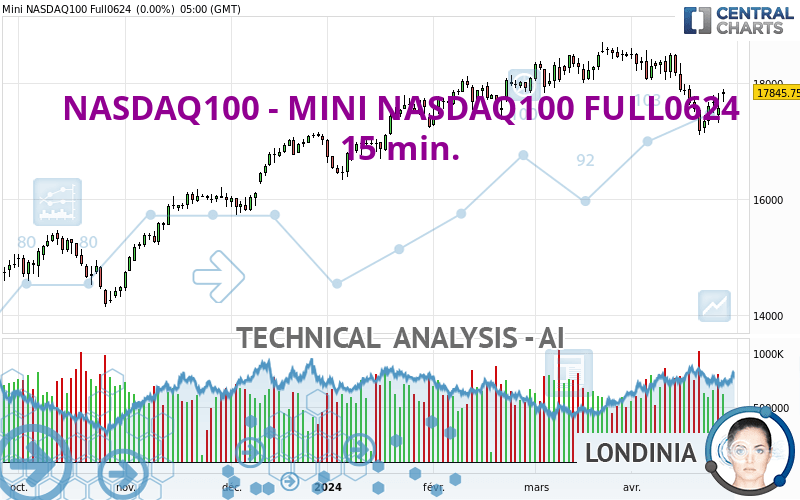
The NASDAQ100 - MINI NASDAQ100 FULL0624 rating is 17,851.75 USD. On the day, this instrument gained +0.03% and was between 17,791.25 USD and 17,949.00 USD. This implies that the price is at +0.34% from its lowest and at -0.54% from its highest.The Central Gaps scanner detects a bullish opening marking the presence of buyers ahead of sellers at the opening but not sufficiently marked to allow the price to register a quotation gap.
Bullish opening
Type : Bullish
Timeframe : Openning
A study of price movements over other periods shows the following variations:
Near a new HIGH record (5 years)
Type : Bullish
Timeframe : Weekly
Near a new HIGH record (1 year)
Type : Bullish
Timeframe : Weekly
Near a new HIGH record (1st january)
Type : Bullish
Timeframe : Weekly
Near a new LOW record (1 month)
Type : Bearish
Timeframe : Weekly
Technical
A technical analysis in 15 min. of this NASDAQ100 - MINI NASDAQ100 FULL0624 chart shows a bearish trend. The signals given by moving averages are 78.57% bearish. This bearish trend is reinforced by the strong signals currently being given by short-term moving averages. An assessment of moving averages reveals several bearish signals that could impact this trend:
Bearish trend reversal : Moving Average 20
Type : Bearish
Timeframe : 15 minutes
Bearish trend reversal : Moving Average 100
Type : Bearish
Timeframe : 15 minutes
Bearish trend reversal : adaptative moving average 100
Type : Bearish
Timeframe : 15 minutes
An assessment of technical indicators shows a bearish signal.
Caution: the Central Indicators scanner currently detects an excess:
CCI indicator is oversold : under -100
Type : Neutral
Timeframe : 15 minutes
Williams %R indicator is back under -50
Type : Bearish
Timeframe : 15 minutes
Central Patterns, the scanner specializing in chart patterns, did not identify any signals.
Central Candlesticks, the scanner specialised in Japanese candlesticks, detects this inversion signal that could impact the current short-term trend:
Doji
Type : Neutral
Timeframe : 15 minutes
| S3 | S2 | S1 | Price | R1 | R2 | R3 | |
|---|---|---|---|---|---|---|---|
| ProTrendLines | 17,307.94 | 17,444.50 | 17,767.10 | 17,851.75 | 17,988.00 | 18,064.75 | 18,585.75 |
| Change (%) | -3.05% | -2.28% | -0.47% | - | +0.76% | +1.19% | +4.11% |
| Change | -543.81 | -407.25 | -84.65 | - | +136.25 | +213.00 | +734.00 |
| Level | Intermediate | Minor | Major | - | Intermediate | Minor | Intermediate |
Pivot points can also be used to set your price objectives. Here is the price situation in relation to pivot points:
| Pivot points | S3 | S2 | S1 | PP | R1 | R2 | R3 |
|---|---|---|---|---|---|---|---|
| Standard | 17,475.58 | 17,571.92 | 17,708.83 | 17,805.17 | 17,942.08 | 18,038.42 | 18,175.33 |
| Camarilla | 17,781.61 | 17,802.99 | 17,824.37 | 17,845.75 | 17,867.13 | 17,888.51 | 17,909.89 |
| Woodie | 17,495.88 | 17,582.06 | 17,729.13 | 17,815.31 | 17,962.38 | 18,048.56 | 18,195.63 |
| Fibonacci | 17,571.92 | 17,661.02 | 17,716.07 | 17,805.17 | 17,894.27 | 17,949.32 | 18,038.42 |
| Pivot points | S3 | S2 | S1 | PP | R1 | R2 | R3 |
|---|---|---|---|---|---|---|---|
| Standard | 16,609.33 | 16,878.92 | 17,362.33 | 17,631.92 | 18,115.33 | 18,384.92 | 18,868.33 |
| Camarilla | 17,638.68 | 17,707.70 | 17,776.73 | 17,845.75 | 17,914.78 | 17,983.80 | 18,052.83 |
| Woodie | 16,716.25 | 16,932.38 | 17,469.25 | 17,685.38 | 18,222.25 | 18,438.38 | 18,975.25 |
| Fibonacci | 16,878.92 | 17,166.56 | 17,344.27 | 17,631.92 | 17,919.56 | 18,097.27 | 18,384.92 |
| Pivot points | S3 | S2 | S1 | PP | R1 | R2 | R3 |
|---|---|---|---|---|---|---|---|
| Standard | 17,396.58 | 17,701.42 | 18,099.33 | 18,404.17 | 18,802.08 | 19,106.92 | 19,504.83 |
| Camarilla | 18,303.99 | 18,368.41 | 18,432.83 | 18,497.25 | 18,561.67 | 18,626.09 | 18,690.51 |
| Woodie | 17,443.13 | 17,724.69 | 18,145.88 | 18,427.44 | 18,848.63 | 19,130.19 | 19,551.38 |
| Fibonacci | 17,701.42 | 17,969.87 | 18,135.72 | 18,404.17 | 18,672.62 | 18,838.47 | 19,106.92 |
Numerical data
The following is the status of the technical indicators and moving averages at the time of publication of this technical analysis:
| RSI (14): | 37.23 | |
| MACD (12,26,9): | -8.1000 | |
| Directional Movement: | -27.78 | |
| AROON (14): | -35.72 | |
| DEMA (21): | 17,879.01 | |
| Parabolic SAR (0,02-0,02-0,2): | 17,922.54 | |
| Elder Ray (13): | -41.83 | |
| Super Trend (3,10): | 17,932.65 | |
| Zig ZAG (10): | 17,848.50 | |
| VORTEX (21): | 0.9400 | |
| Stochastique (14,3,5): | 40.05 | |
| TEMA (21): | 17,869.54 | |
| Williams %R (14): | -62.21 | |
| Chande Momentum Oscillator (20): | -60.75 | |
| Repulse (5,40,3): | -0.0400 | |
| ROCnROLL: | 2 | |
| TRIX (15,9): | 0.0000 | |
| Courbe Coppock: | 0.14 |
| MA7: | 17,580.39 | |
| MA20: | 17,931.15 | |
| MA50: | 18,163.03 | |
| MA100: | 17,792.46 | |
| MAexp7: | 17,871.38 | |
| MAexp20: | 17,887.15 | |
| MAexp50: | 17,890.46 | |
| MAexp100: | 17,867.10 | |
| Price / MA7: | +1.54% | |
| Price / MA20: | -0.44% | |
| Price / MA50: | -1.71% | |
| Price / MA100: | +0.33% | |
| Price / MAexp7: | -0.11% | |
| Price / MAexp20: | -0.20% | |
| Price / MAexp50: | -0.22% | |
| Price / MAexp100: | -0.09% |
About author

Online


Add a comment
Comments
0 comments on the analysis NASDAQ100 - MINI NASDAQ100 FULL0624 - 15 min.