NASDAQ100 - MINI NASDAQ100 FULL0624 - 15 min. - Technical analysis published on 05/02/2024 (GMT)
- 75
- 0
Click here for a new analysis!
- Timeframe : 15 min.
- - Analysis generated on
- Status : TARGET REACHED
Summary of the analysis

Additional analysis
Quotes
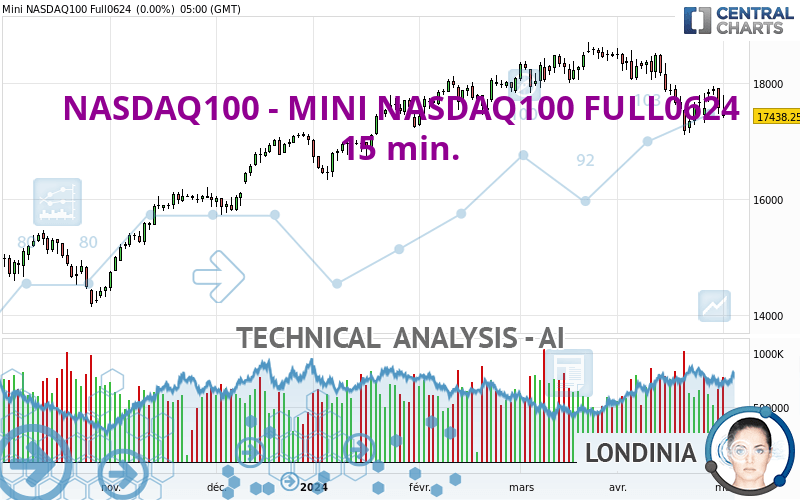
The NASDAQ100 - MINI NASDAQ100 FULL0624 rating is 17,593.75 USD. On the day, this instrument gained +0.89% and was traded between 17,386.25 USD and 17,619.75 USD over the period. The price is currently at +1.19% from its lowest and -0.15% from its highest.The Central Gaps scanner detects a bullish opening marking the presence of buyers ahead of sellers at the opening but not sufficiently marked to allow the price to register a quotation gap.
Bullish opening
Type : Bullish
Timeframe : Openning
Here is a more detailed summary of the historical variations registered by NASDAQ100 - MINI NASDAQ100 FULL0624:
Near a new HIGH record (5 years)
Type : Bullish
Timeframe : Weekly
Near a new LOW record (1st january)
Type : Bearish
Timeframe : Weekly
Near a new LOW record (1 month)
Type : Bearish
Timeframe : Weekly
Technical
Technical analysis of NASDAQ100 - MINI NASDAQ100 FULL0624 in 15 min. shows an overall bullish trend. The signals returned by the moving averages are 75.00% bullish. This bullish trend is reinforced by the strong signals currently being given by short-term moving averages. An assessment of moving averages reveals several bullish signals that could impact this trend:
Bullish trend reversal : Moving Average 50
Type : Bullish
Timeframe : 15 minutes
Bullish trend reversal : adaptative moving average 20
Type : Bullish
Timeframe : 15 minutes
Bullish trend reversal : adaptative moving average 50
Type : Bullish
Timeframe : 15 minutes
Bullish trend reversal : adaptative moving average 100
Type : Bullish
Timeframe : 15 minutes
In fact, 12 technical indicators on 18 studied are currently bullish. Caution: the Central Indicators scanner currently detects an excess:
CCI indicator is overbought : over 100
Type : Neutral
Timeframe : 15 minutes
Williams %R indicator is overbought : over -20
Type : Neutral
Timeframe : 15 minutes
Aroon indicator bullish trend
Type : Bullish
Timeframe : 15 minutes
Price is back under the pivot point
Type : Bearish
Timeframe : Weekly
Central Patterns, the scanner specializing in chart patterns, did not identify any signals.
The presence of a bearish pattern in Japanese candlesticks detected by Central Candlesticks that could cause a correction in the very short term was also detected:
Bearish harami
Type : Bearish
Timeframe : 15 minutes
| S3 | S2 | S1 | Price | R1 | R2 | R3 | |
|---|---|---|---|---|---|---|---|
| ProTrendLines | 17,307.94 | 17,401.33 | 17,525.40 | 17,593.75 | 17,668.00 | 17,767.10 | 17,949.00 |
| Change (%) | -1.62% | -1.09% | -0.39% | - | +0.42% | +0.99% | +2.02% |
| Change | -285.81 | -192.42 | -68.35 | - | +74.25 | +173.35 | +355.25 |
| Level | Intermediate | Intermediate | Minor | - | Minor | Major | Minor |
Pivot points can also be used to set your price objectives. Here is the price situation in relation to pivot points:
| Pivot points | S3 | S2 | S1 | PP | R1 | R2 | R3 |
|---|---|---|---|---|---|---|---|
| Standard | 16,899.92 | 17,149.58 | 17,293.92 | 17,543.58 | 17,687.92 | 17,937.58 | 18,081.92 |
| Camarilla | 17,329.90 | 17,366.02 | 17,402.13 | 17,438.25 | 17,474.37 | 17,510.48 | 17,546.60 |
| Woodie | 16,847.25 | 17,123.25 | 17,241.25 | 17,517.25 | 17,635.25 | 17,911.25 | 18,029.25 |
| Fibonacci | 17,149.58 | 17,300.09 | 17,393.08 | 17,543.58 | 17,694.09 | 17,787.08 | 17,937.58 |
| Pivot points | S3 | S2 | S1 | PP | R1 | R2 | R3 |
|---|---|---|---|---|---|---|---|
| Standard | 16,609.33 | 16,878.92 | 17,362.33 | 17,631.92 | 18,115.33 | 18,384.92 | 18,868.33 |
| Camarilla | 17,638.68 | 17,707.70 | 17,776.73 | 17,845.75 | 17,914.78 | 17,983.80 | 18,052.83 |
| Woodie | 16,716.25 | 16,932.38 | 17,469.25 | 17,685.38 | 18,222.25 | 18,438.38 | 18,975.25 |
| Fibonacci | 16,878.92 | 17,166.56 | 17,344.27 | 17,631.92 | 17,919.56 | 18,097.27 | 18,384.92 |
| Pivot points | S3 | S2 | S1 | PP | R1 | R2 | R3 |
|---|---|---|---|---|---|---|---|
| Standard | 15,390.25 | 16,251.75 | 16,845.00 | 17,706.50 | 18,299.75 | 19,161.25 | 19,754.50 |
| Camarilla | 17,038.19 | 17,171.55 | 17,304.90 | 17,438.25 | 17,571.60 | 17,704.95 | 17,838.31 |
| Woodie | 15,256.13 | 16,184.69 | 16,710.88 | 17,639.44 | 18,165.63 | 19,094.19 | 19,620.38 |
| Fibonacci | 16,251.75 | 16,807.47 | 17,150.79 | 17,706.50 | 18,262.22 | 18,605.54 | 19,161.25 |
Numerical data
The following are the details of the technical indicators and moving averages that were collected to generate this technical analysis:
| RSI (14): | 54.75 | |
| MACD (12,26,9): | -1.5500 | |
| Directional Movement: | 0.71 | |
| AROON (14): | 85.72 | |
| DEMA (21): | 17,540.75 | |
| Parabolic SAR (0,02-0,02-0,2): | 17,411.27 | |
| Elder Ray (13): | 36.19 | |
| Super Trend (3,10): | 17,447.42 | |
| Zig ZAG (10): | 17,583.00 | |
| VORTEX (21): | 1.0000 | |
| Stochastique (14,3,5): | 86.95 | |
| TEMA (21): | 17,548.85 | |
| Williams %R (14): | -2.18 | |
| Chande Momentum Oscillator (20): | 140.50 | |
| Repulse (5,40,3): | 0.3100 | |
| ROCnROLL: | 1 | |
| TRIX (15,9): | -0.0100 | |
| Courbe Coppock: | 0.45 |
| MA7: | 17,654.36 | |
| MA20: | 17,824.36 | |
| MA50: | 18,142.29 | |
| MA100: | 17,821.42 | |
| MAexp7: | 17,565.50 | |
| MAexp20: | 17,545.31 | |
| MAexp50: | 17,548.36 | |
| MAexp100: | 17,551.88 | |
| Price / MA7: | -0.34% | |
| Price / MA20: | -1.29% | |
| Price / MA50: | -3.02% | |
| Price / MA100: | -1.28% | |
| Price / MAexp7: | +0.16% | |
| Price / MAexp20: | +0.28% | |
| Price / MAexp50: | +0.26% | |
| Price / MAexp100: | +0.24% |
About author

Online


Add a comment
Comments
0 comments on the analysis NASDAQ100 - MINI NASDAQ100 FULL0624 - 15 min.